What is on the Overview tab?
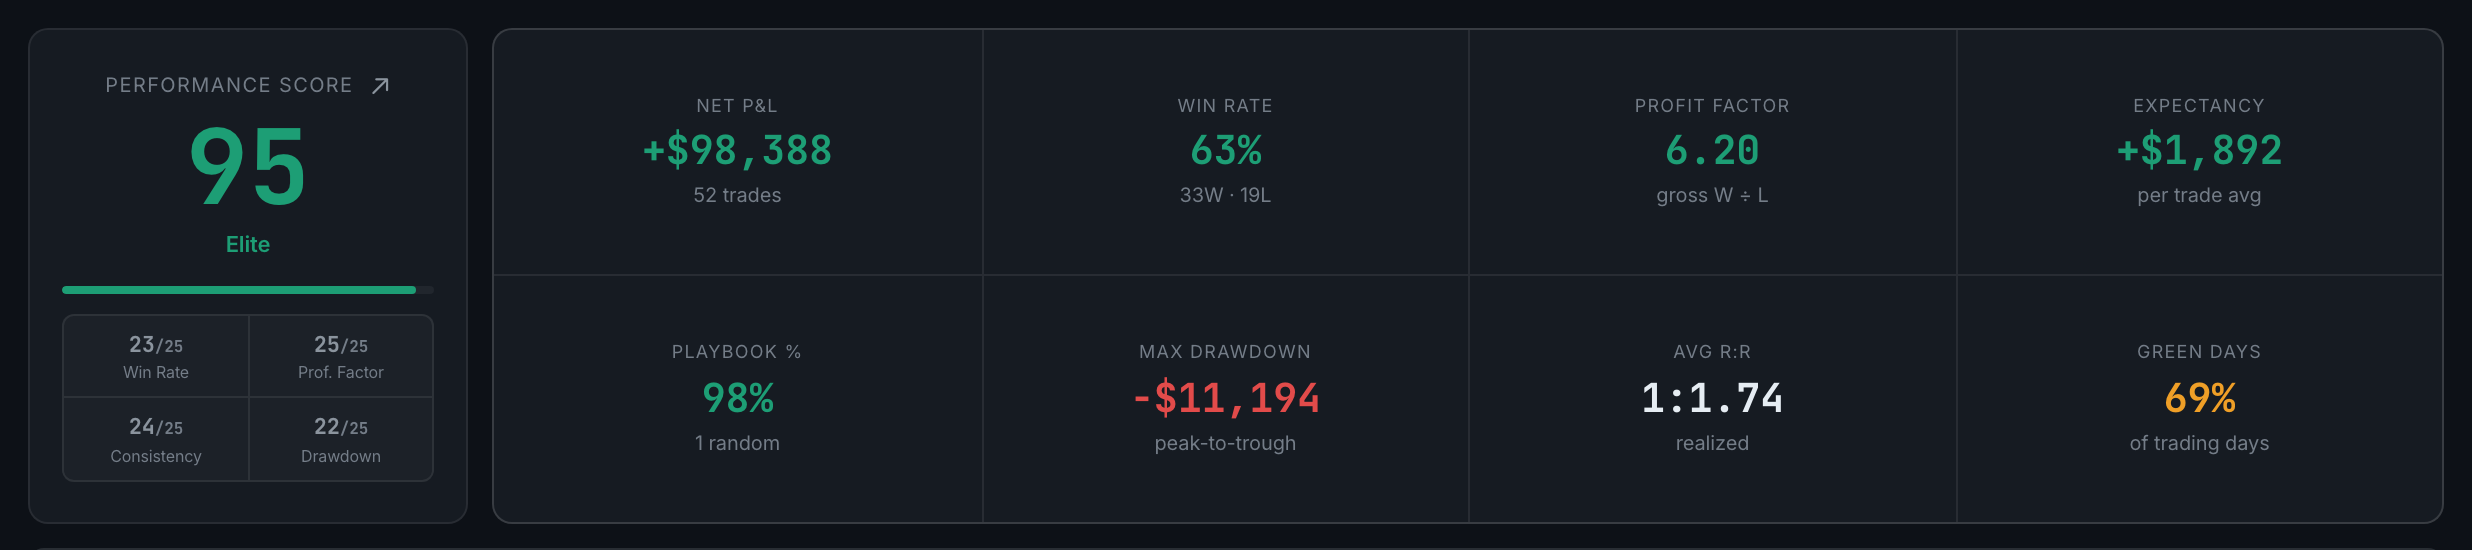
Two sub-pages. Scorecard holds your 0–100 score, the headline stats and the equity curve; Trends & Highlights holds the expectancy trend, your top performers and the advanced metrics.
Overview is the tab to open when you do not have a specific question yet. It answers "am I any good at this, and is it getting better or worse", and everything on it is a summary of something you can dig into on another tab.
- ScorecardThe performance score and how it was made up, the headline figures (net P&L, win rate, profit factor, expectancy, playbook percentage, max drawdown, average R:R and green days), the break-even honesty line, your equity curve and your recent activity.
- Trends & HighlightsHow your expectancy is moving over time, your best and worst performers, and the advanced metrics that do not fit on the scorecard.