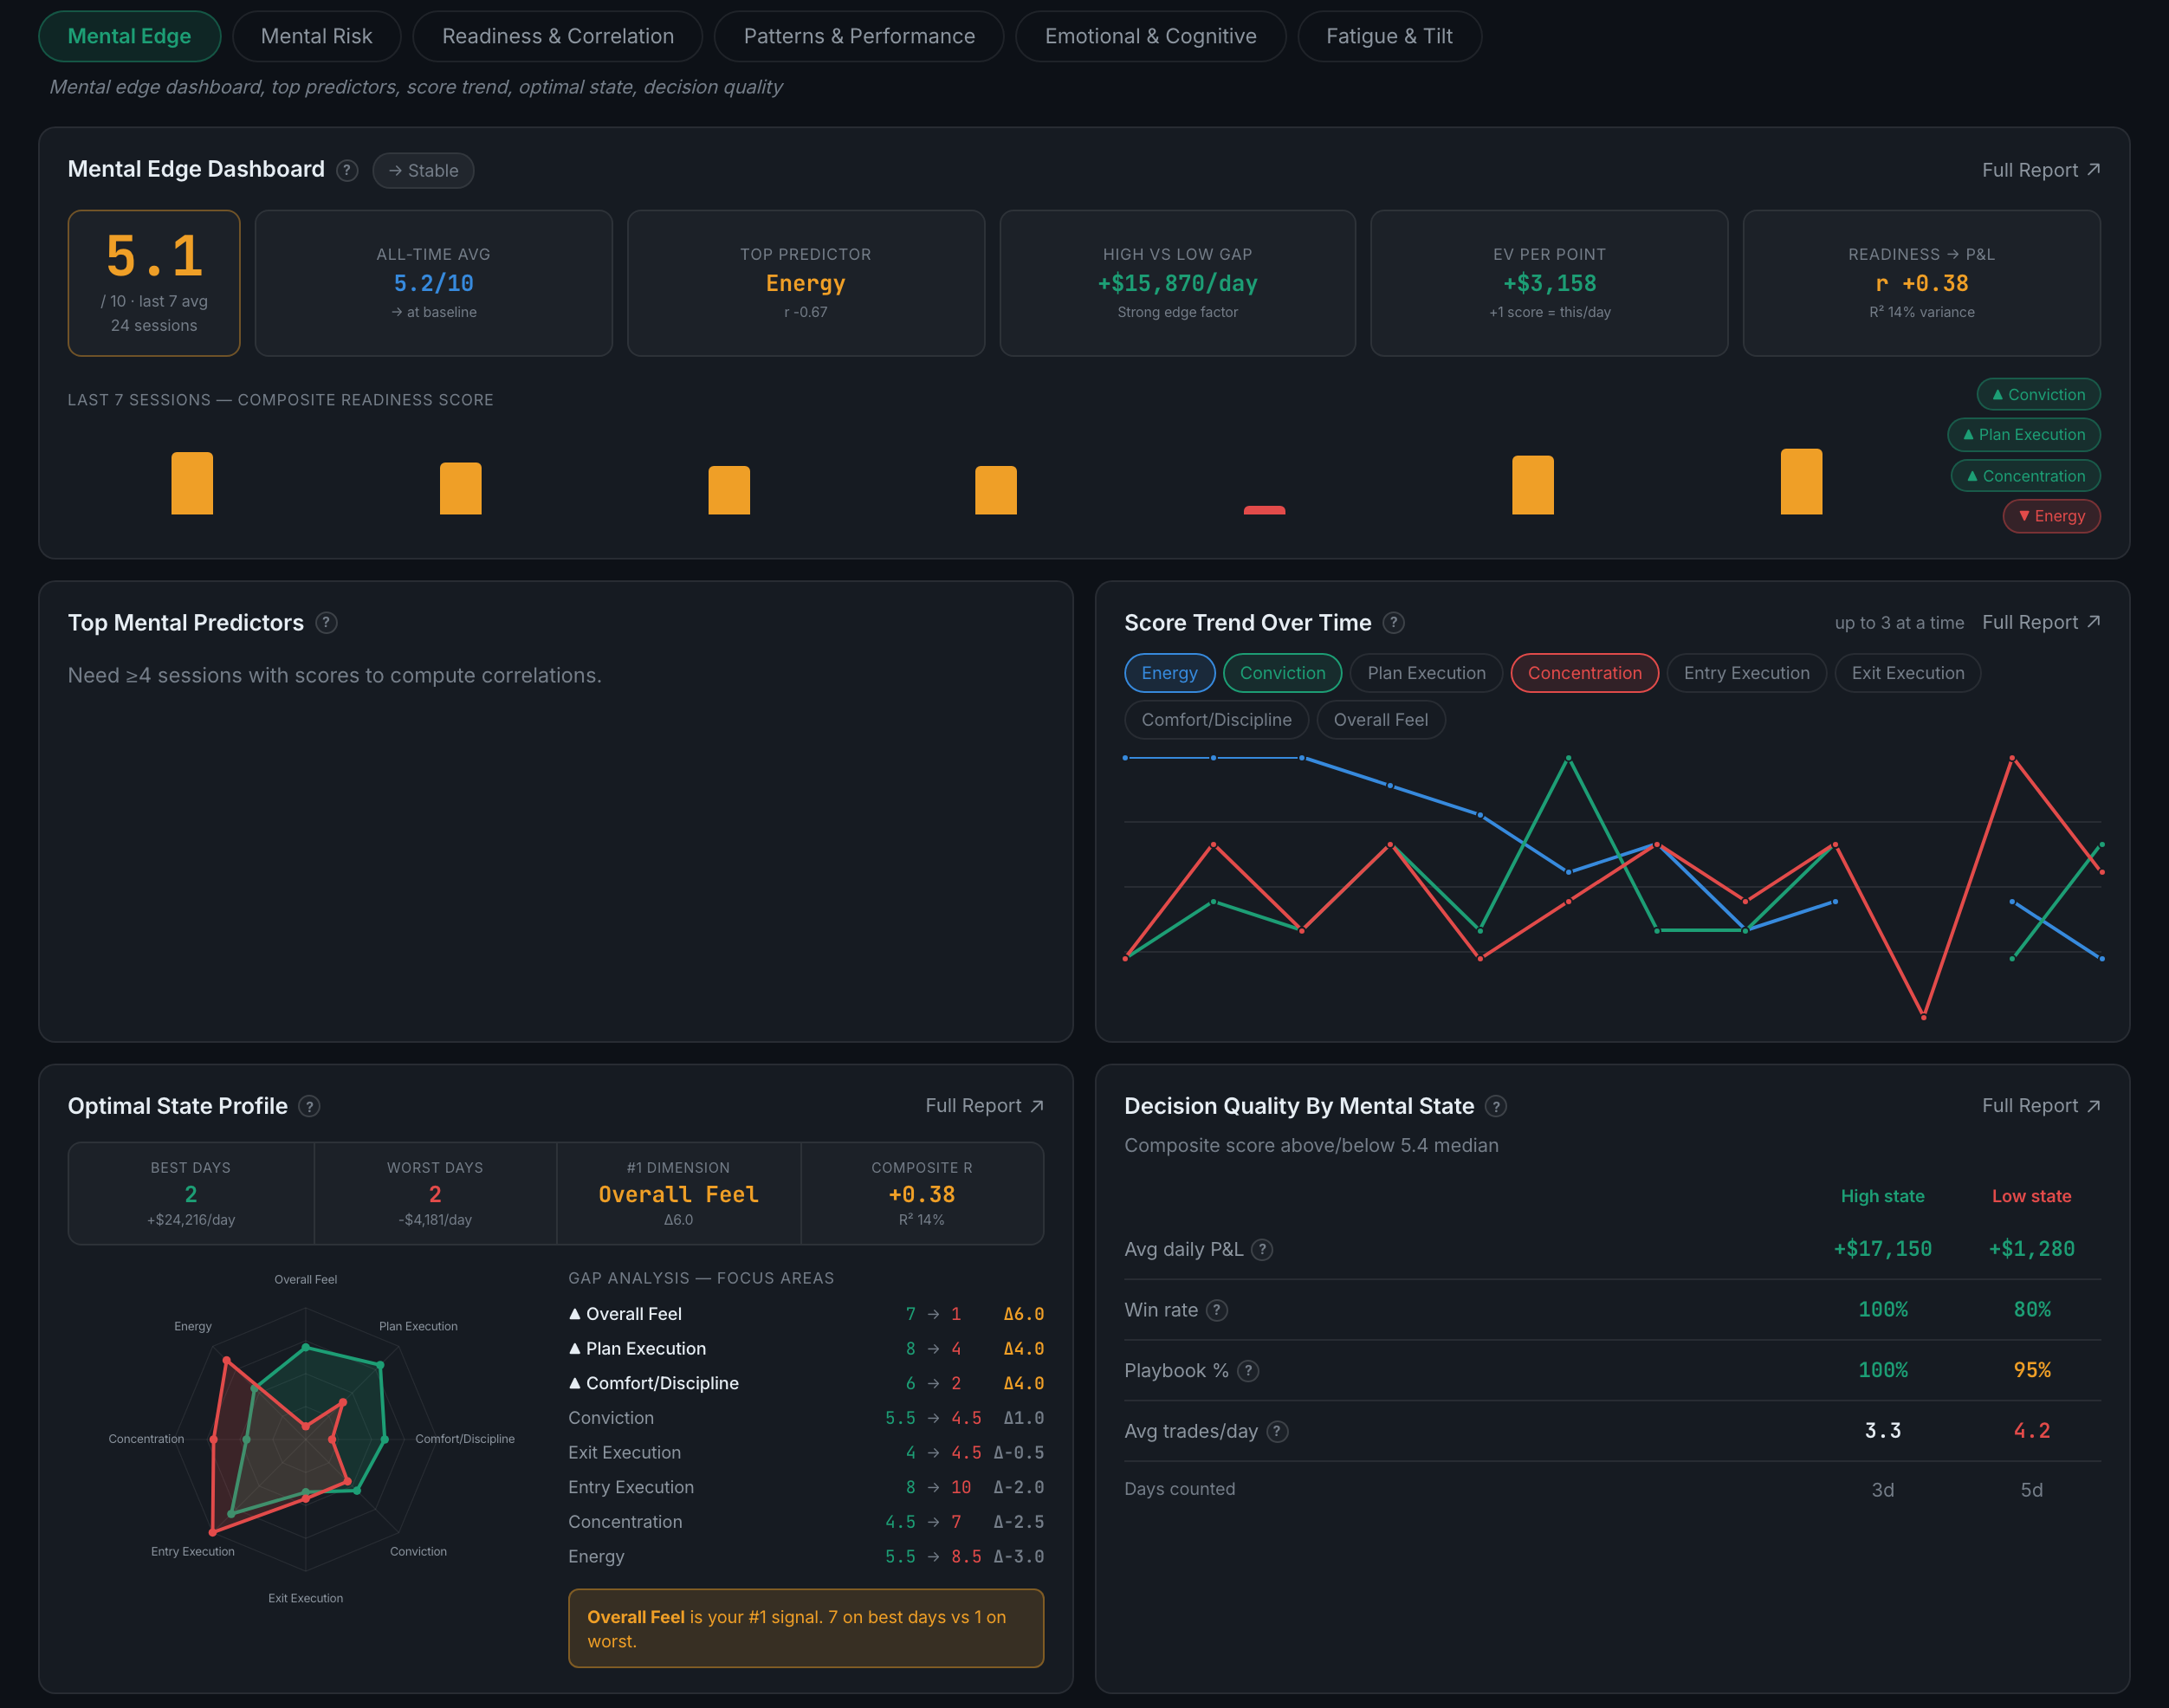
What is on the Mental Edge sub-page?
The positive half of the psychology picture — which mental factors predict your good days, how your scores are trending, and what your best state actually looks like.
Mental Edge asks what conditions you perform in, rather than what goes wrong. Each panel correlates something you scored yourself on against something the market paid you, and reports how strong the link is.
Indicators on this sub-page:
- Mental Edge DashboardSix figures across the top: your composite score out of ten with the number of sessions behind it, your all-time average, your top predictor with its correlation, the high vs low gap in money per day, the EV per point of composite score, and the correlation and R² between readiness and P&L. Under them, your last seven sessions as bars, and each factor tagged as rising or falling.
- Top Mental PredictorsYour scored dimensions ranked by how well each predicts P&L. A correlation near zero is a real finding: it means that dimension is not the thing holding you back. Needs four or more scored sessions before it will compute.
- Score Trend Over TimeAny three of your eight dimensions plotted together: Energy, Conviction, Plan Execution, Concentration, Entry Execution, Exit Execution, Comfort/Discipline and Overall Feel.
Eight here, nine in the debrief — both are right. The Report Card collects nine scores; this tab's composite is built from eight of them. The one held back is Process focus, and it is held back on purpose: it is used as the splitting variable elsewhere on this tab — your high-process-focus days measured against your low ones — and a number cannot both split the days and be part of the average being compared, or the split would come out favourable by construction. Process focus is not discarded; it is doing a different job.
- Optimal State ProfileA radar chart of your best days against your worst, with the count and value of each, your #1 dimension, and a gap analysis table listing every dimension with its best-day and worst-day score and the delta. The dimensions carrying a ▲ are the ones worth working on.
- Decision Quality by Mental StateYour high-state days against your low-state days, split at your own composite median, compared on average daily P&L, win rate, playbook percentage, average trades per day, and how many days fell in each.