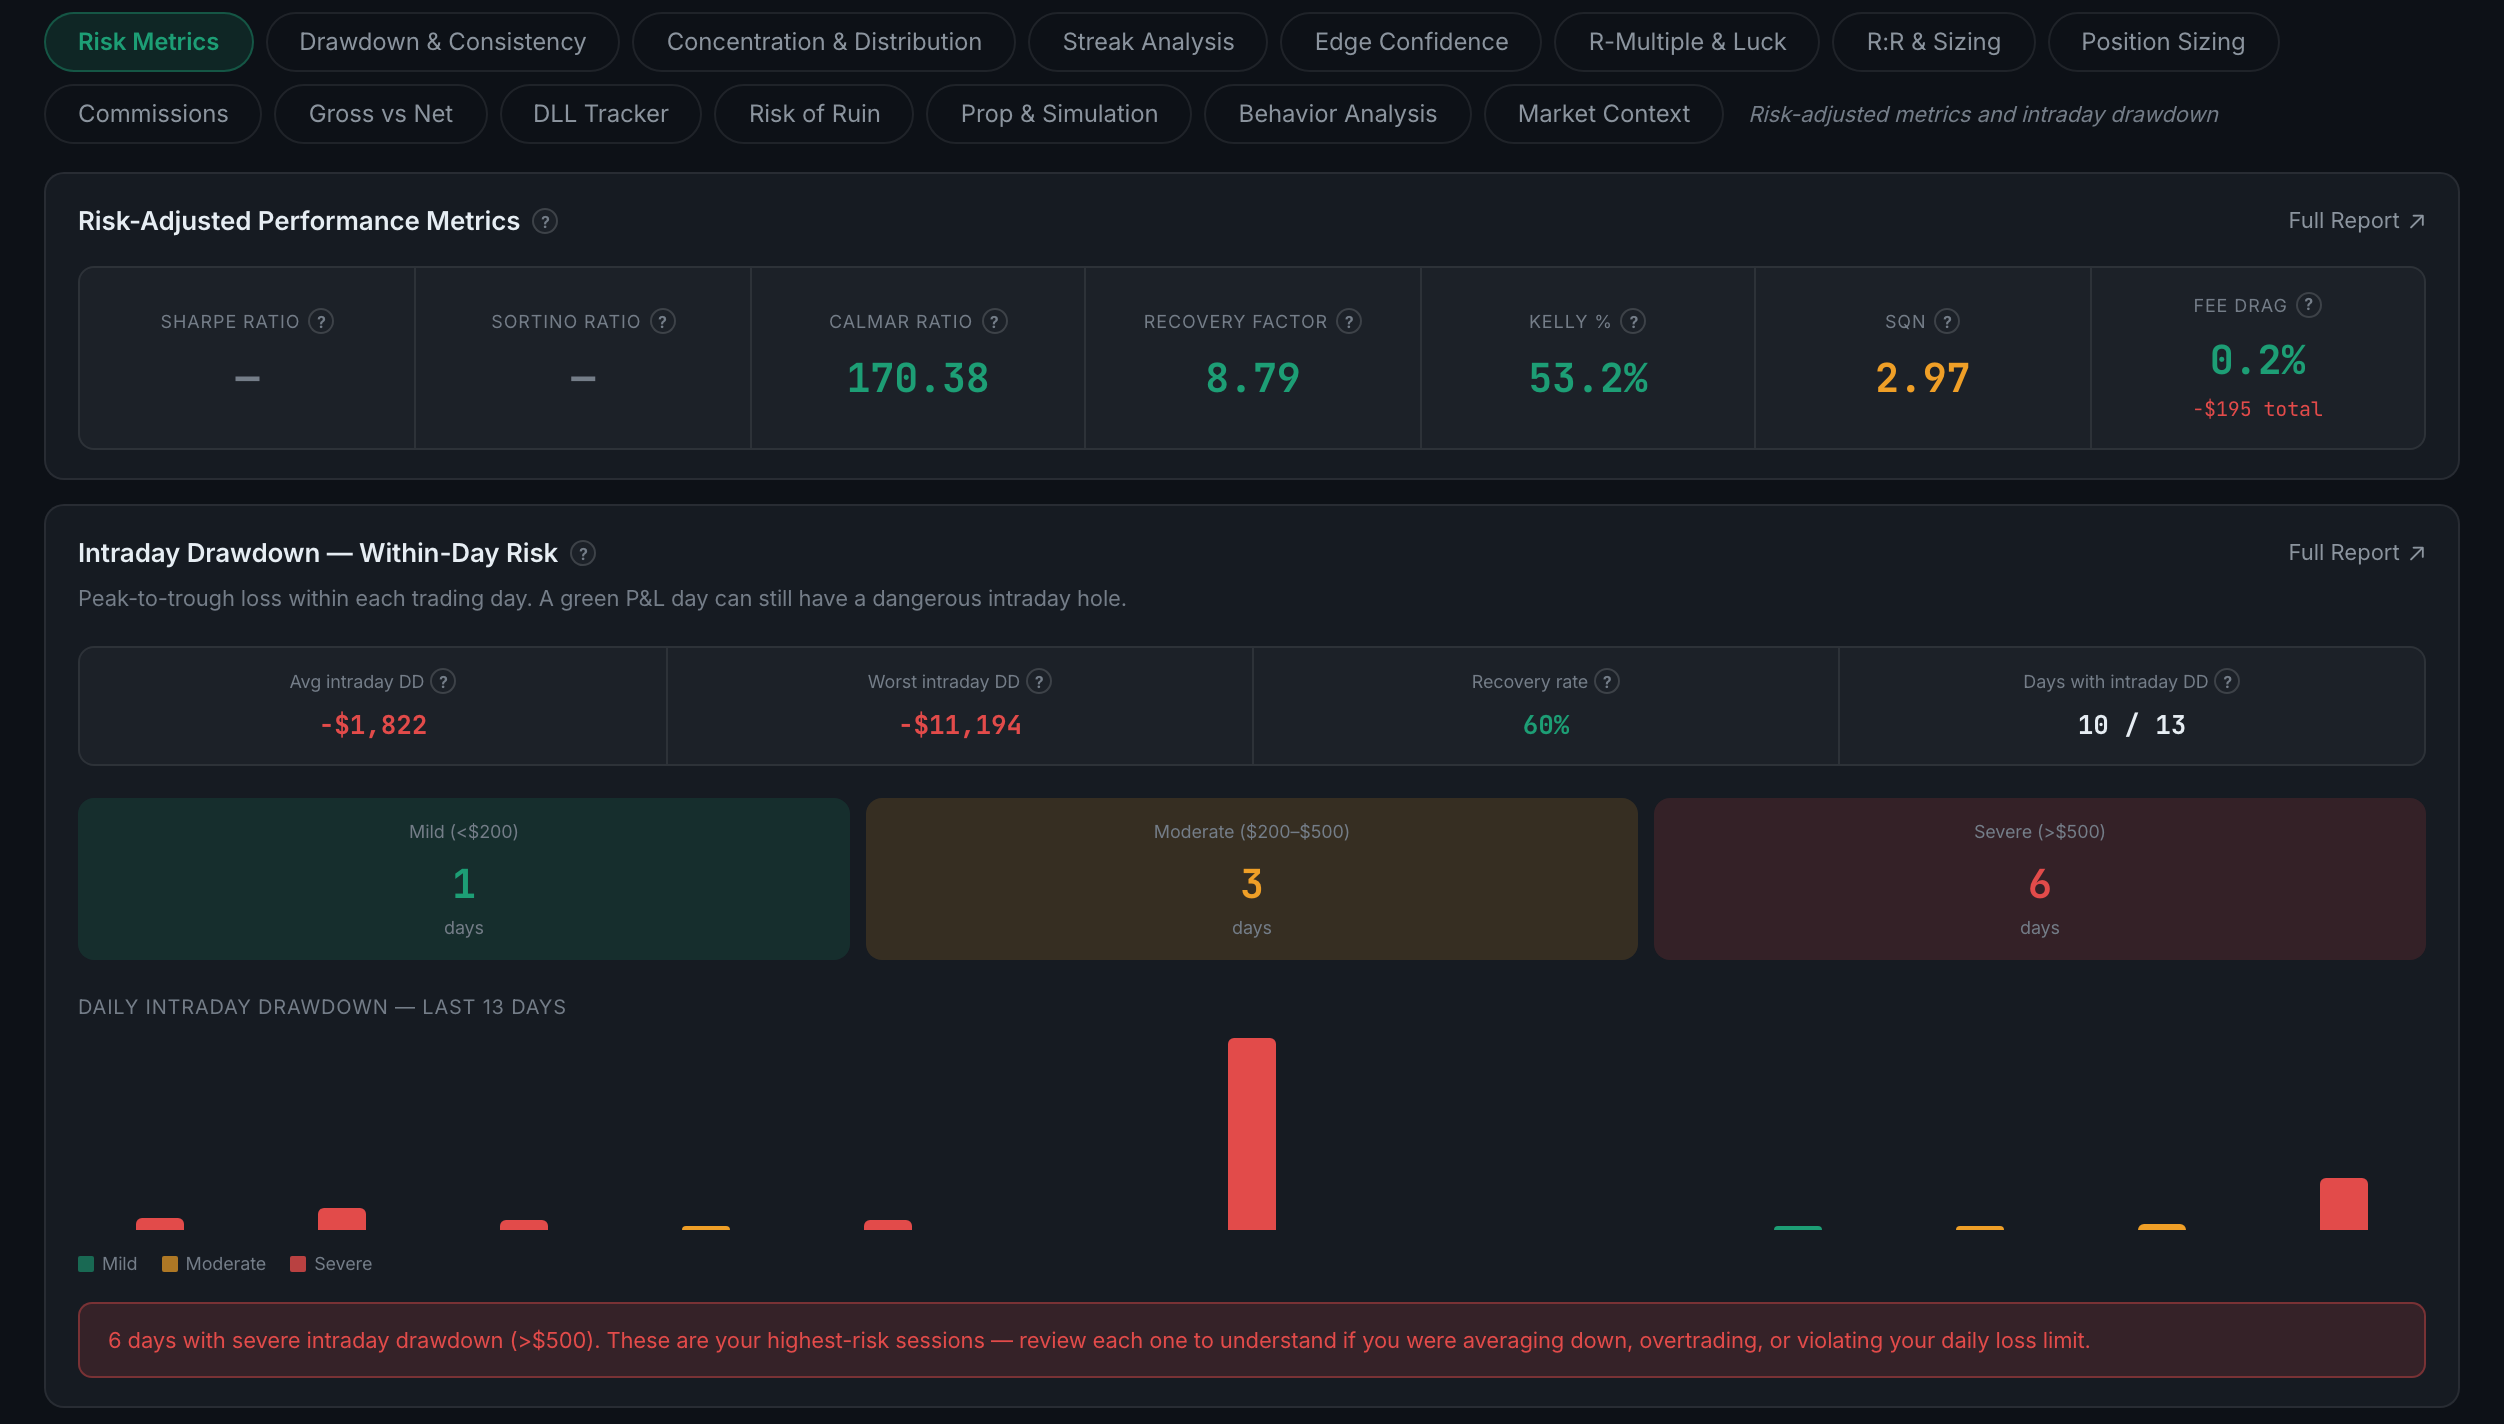
What is on the Risk Metrics sub-page?
The risk-adjusted headline numbers — Sharpe, Sortino, Calmar, Kelly and recovery factor — with intraday drawdown underneath.
The first sub-page of Risk, and the one that turns your P&L into figures that can be compared against something. A profit number on its own says nothing about what it cost to produce; these all divide the return by a measure of the pain.
Indicators on this sub-page:
- Risk-Adjusted Performance MetricsSeven figures in a row: Sharpe, Sortino, Calmar, recovery factor, Kelly %, SQN (system quality number) and fee drag, with the total fees paid under the last one.
- Intraday Drawdown — Within-Day RiskPeak-to-trough loss within each day, which is the risk a daily P&L column cannot show: a green day can still have had a dangerous hole in it. Average and worst intraday drawdown, your recovery rate, and how many of your trading days had one at all. Under those, days sorted into mild (under $200), moderate ($200–$500) and severe (over $500), a bar per day for the recent stretch, and a verdict naming your severe sessions as the ones to review. Needs entry and exit timestamps.
Sharpe and Sortino blank out to a dash on small samples rather than printing a meaningless figure — that is the panel working, not failing. Kelly here is the correct percentage and should be read as a ceiling rather than a target. Both have their own guides below.