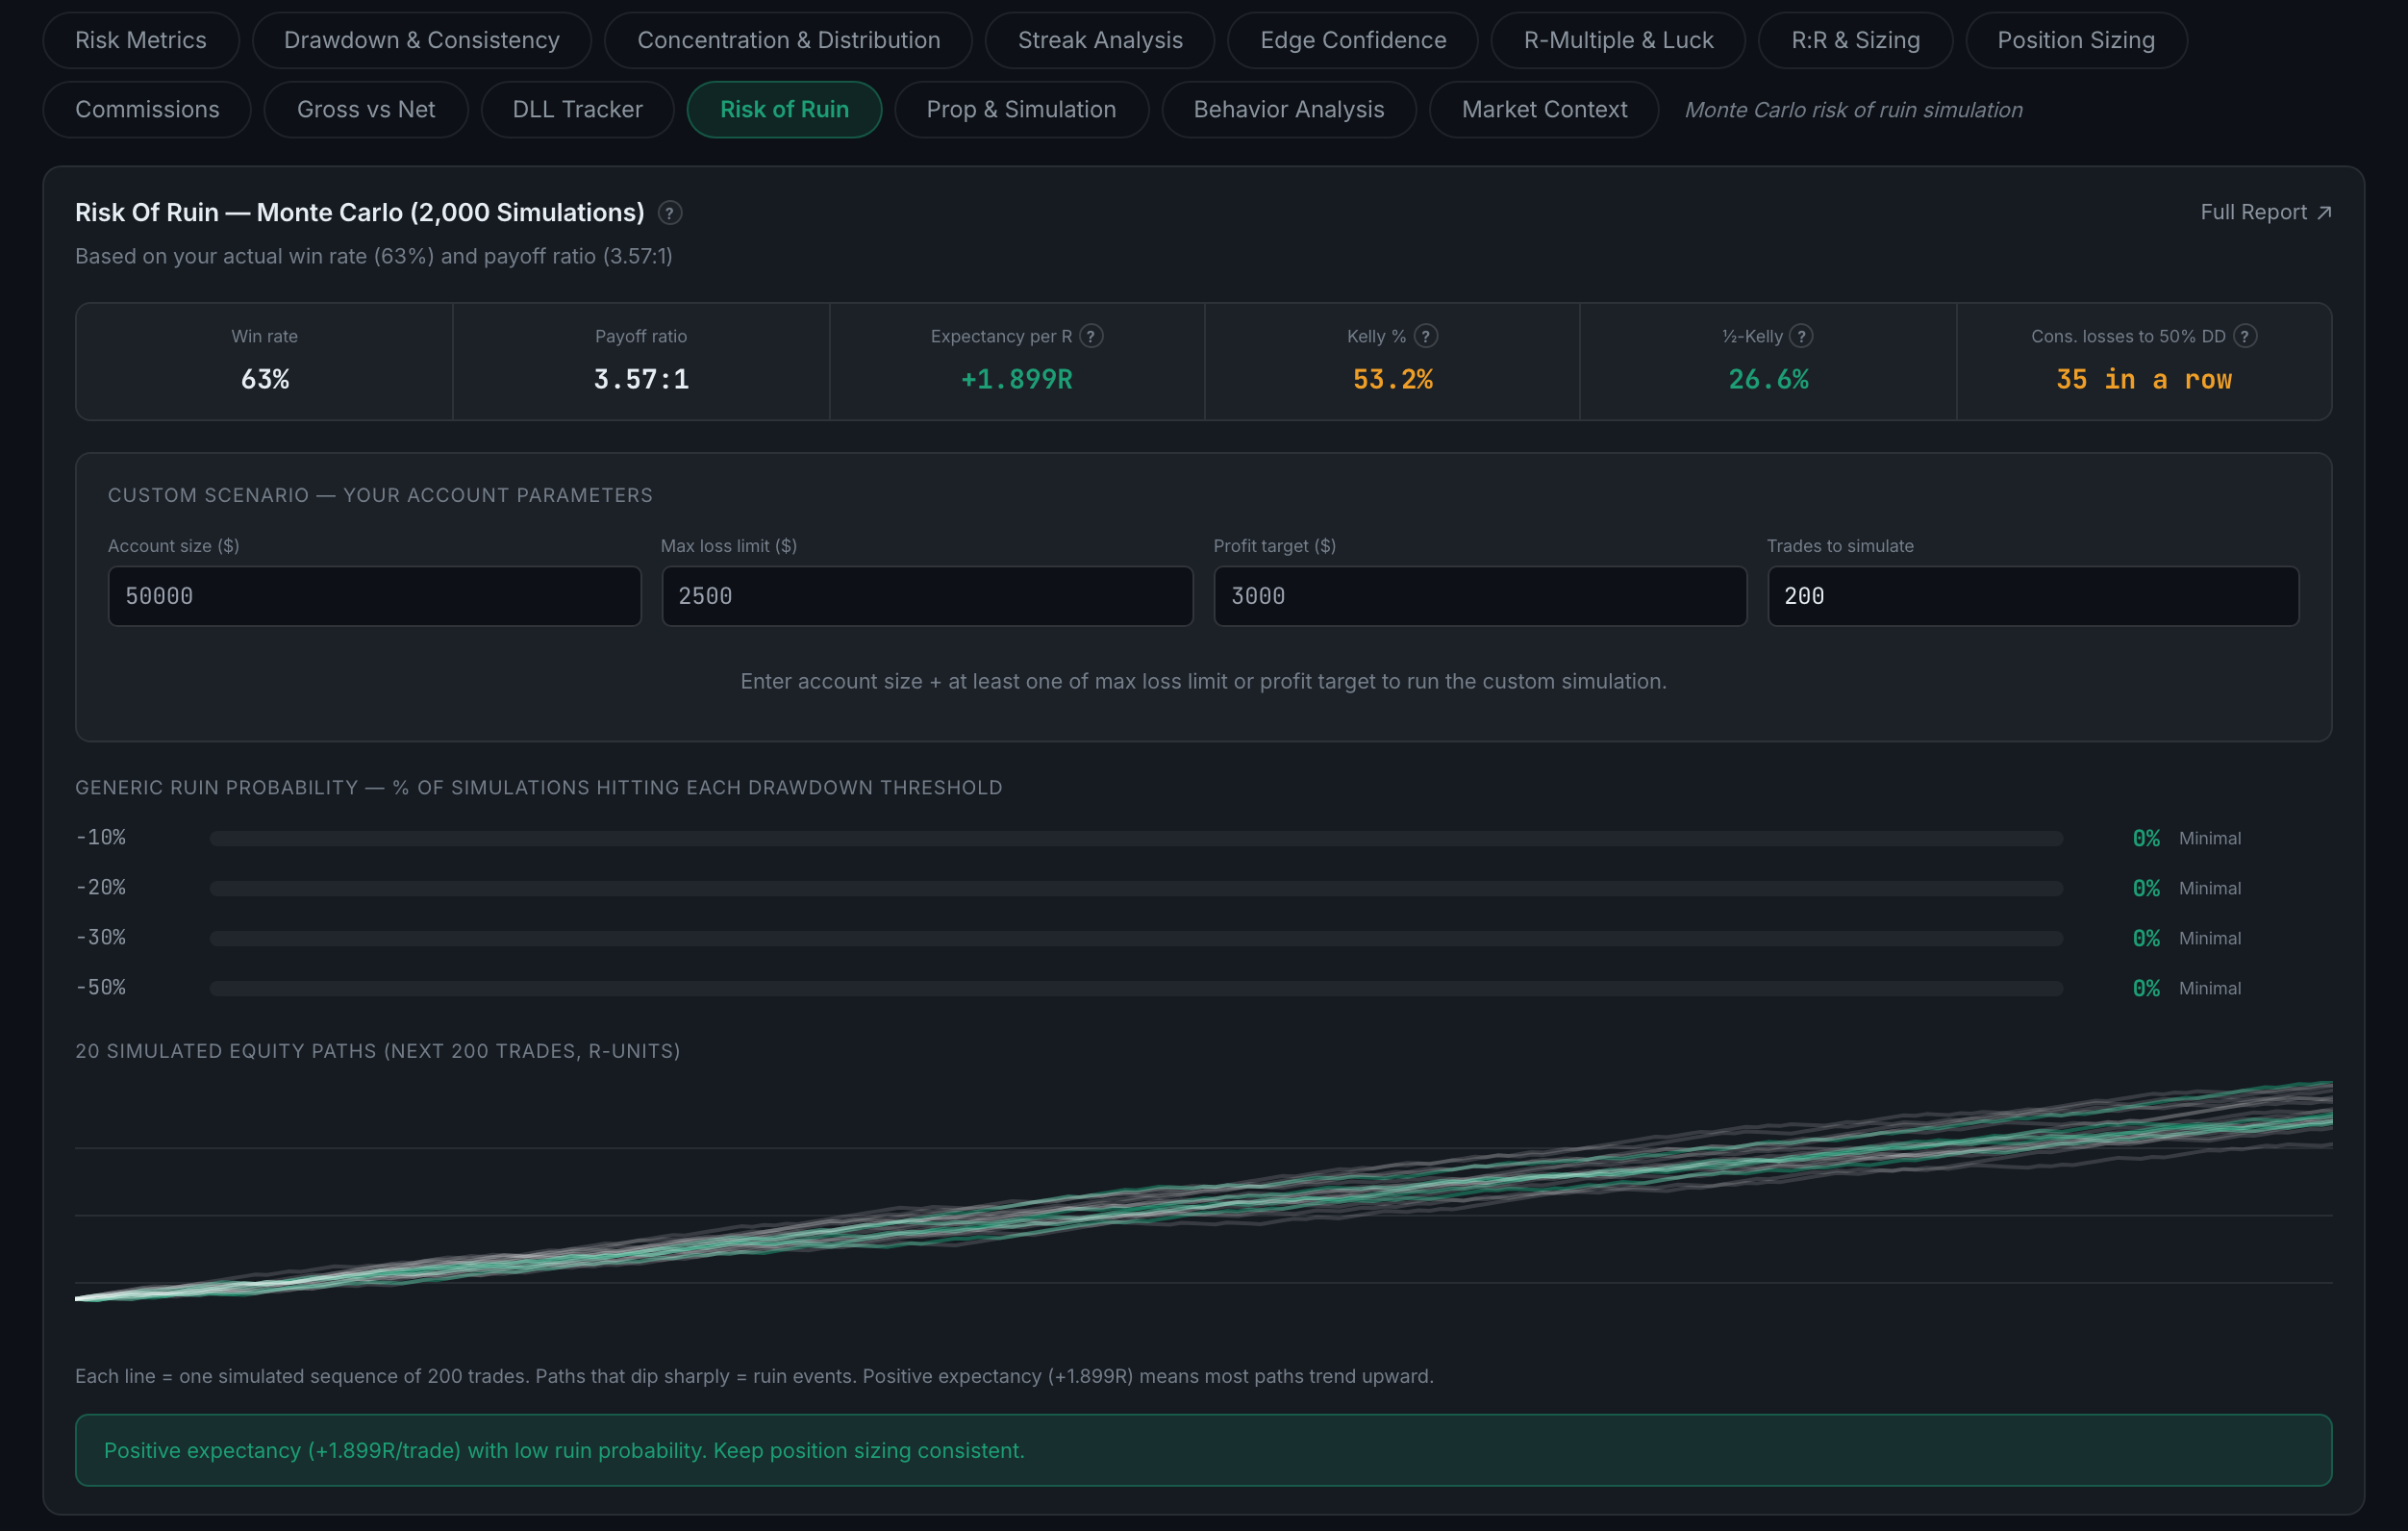
What is Risk of Ruin?
A Monte Carlo simulation of how likely a run of losses is to wipe out your account, given how you actually trade.
Everything else on the Risk tab describes what already happened. This asks what could happen — it takes your win rate, your average win, your average loss and your capital, and runs the sequence many times over to see how often it ends badly.
It runs 2,000 simulations over the next 200 trades by default, and you can put your own account size, loss limit and profit target in to simulate your actual situation. The result is a percentage with a plain-language band beside it: very low at 5% or under, low to about 15%, moderate to 30%, high to 50%, and critical above that. Beside it sits the figure most worth knowing — how many consecutive losses it would take to put you in a 50% drawdown.
The point is not the exact figure — it is that the figure moves violently with position size. The same edge sized at 1% of capital and at 5% produces completely different answers, and seeing that is usually more persuasive than being told to size down.
It computes from your closed trades, so the same caveat applies as everywhere else on this tab: a small sample gives you a confident-looking number built on very little.