What happens when I click a day?
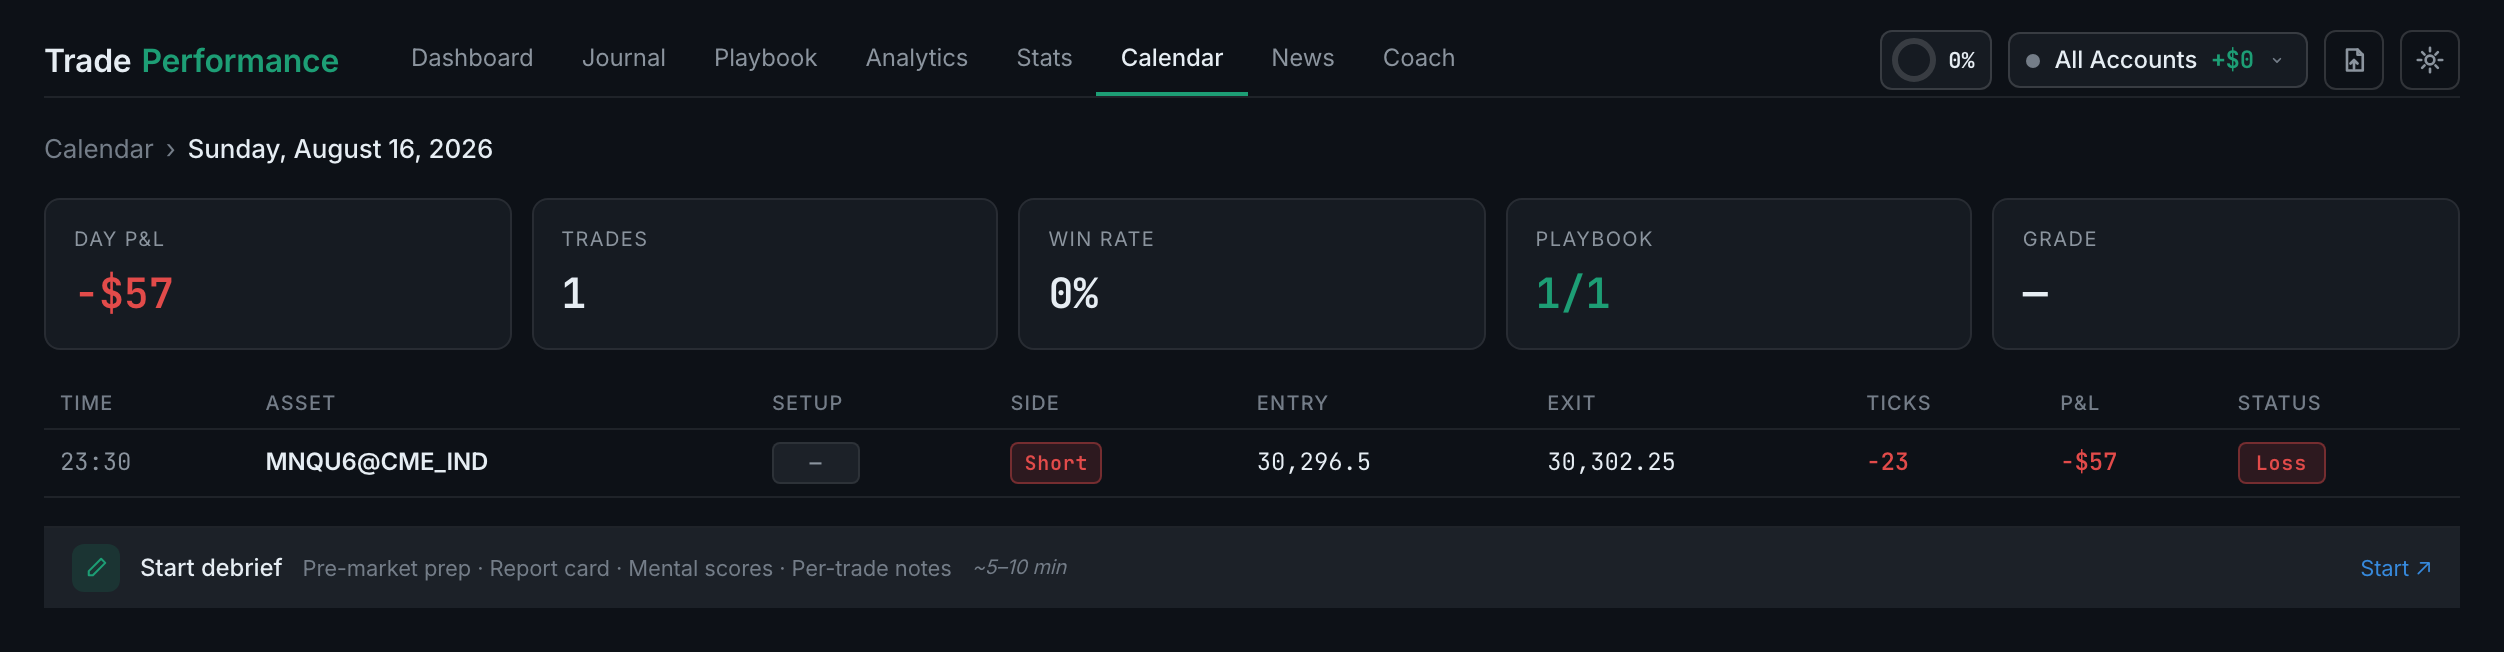
The grid is replaced by that day: five figures across the top, a table of the day's trades, and the debrief panel underneath.
The breadcrumb at the top left reads Calendar › Thursday, August 20, 2026, and clicking Calendar takes you back to the month.
Across the top: Day P&L, Trades, Win rate, Playbook and Grade. Playbook is the one worth reading twice — it shows how many of the day's trades came from your playbook out of the total, and turns red the moment any of them did not. If there were random trades, an amber banner under the figures says how many, in words.
Then the day's trades as a table: time, asset, setup, side, entry, exit, ticks, P&L and status. A day with no trades says so rather than showing an empty table.
Under all of it sits the debrief.