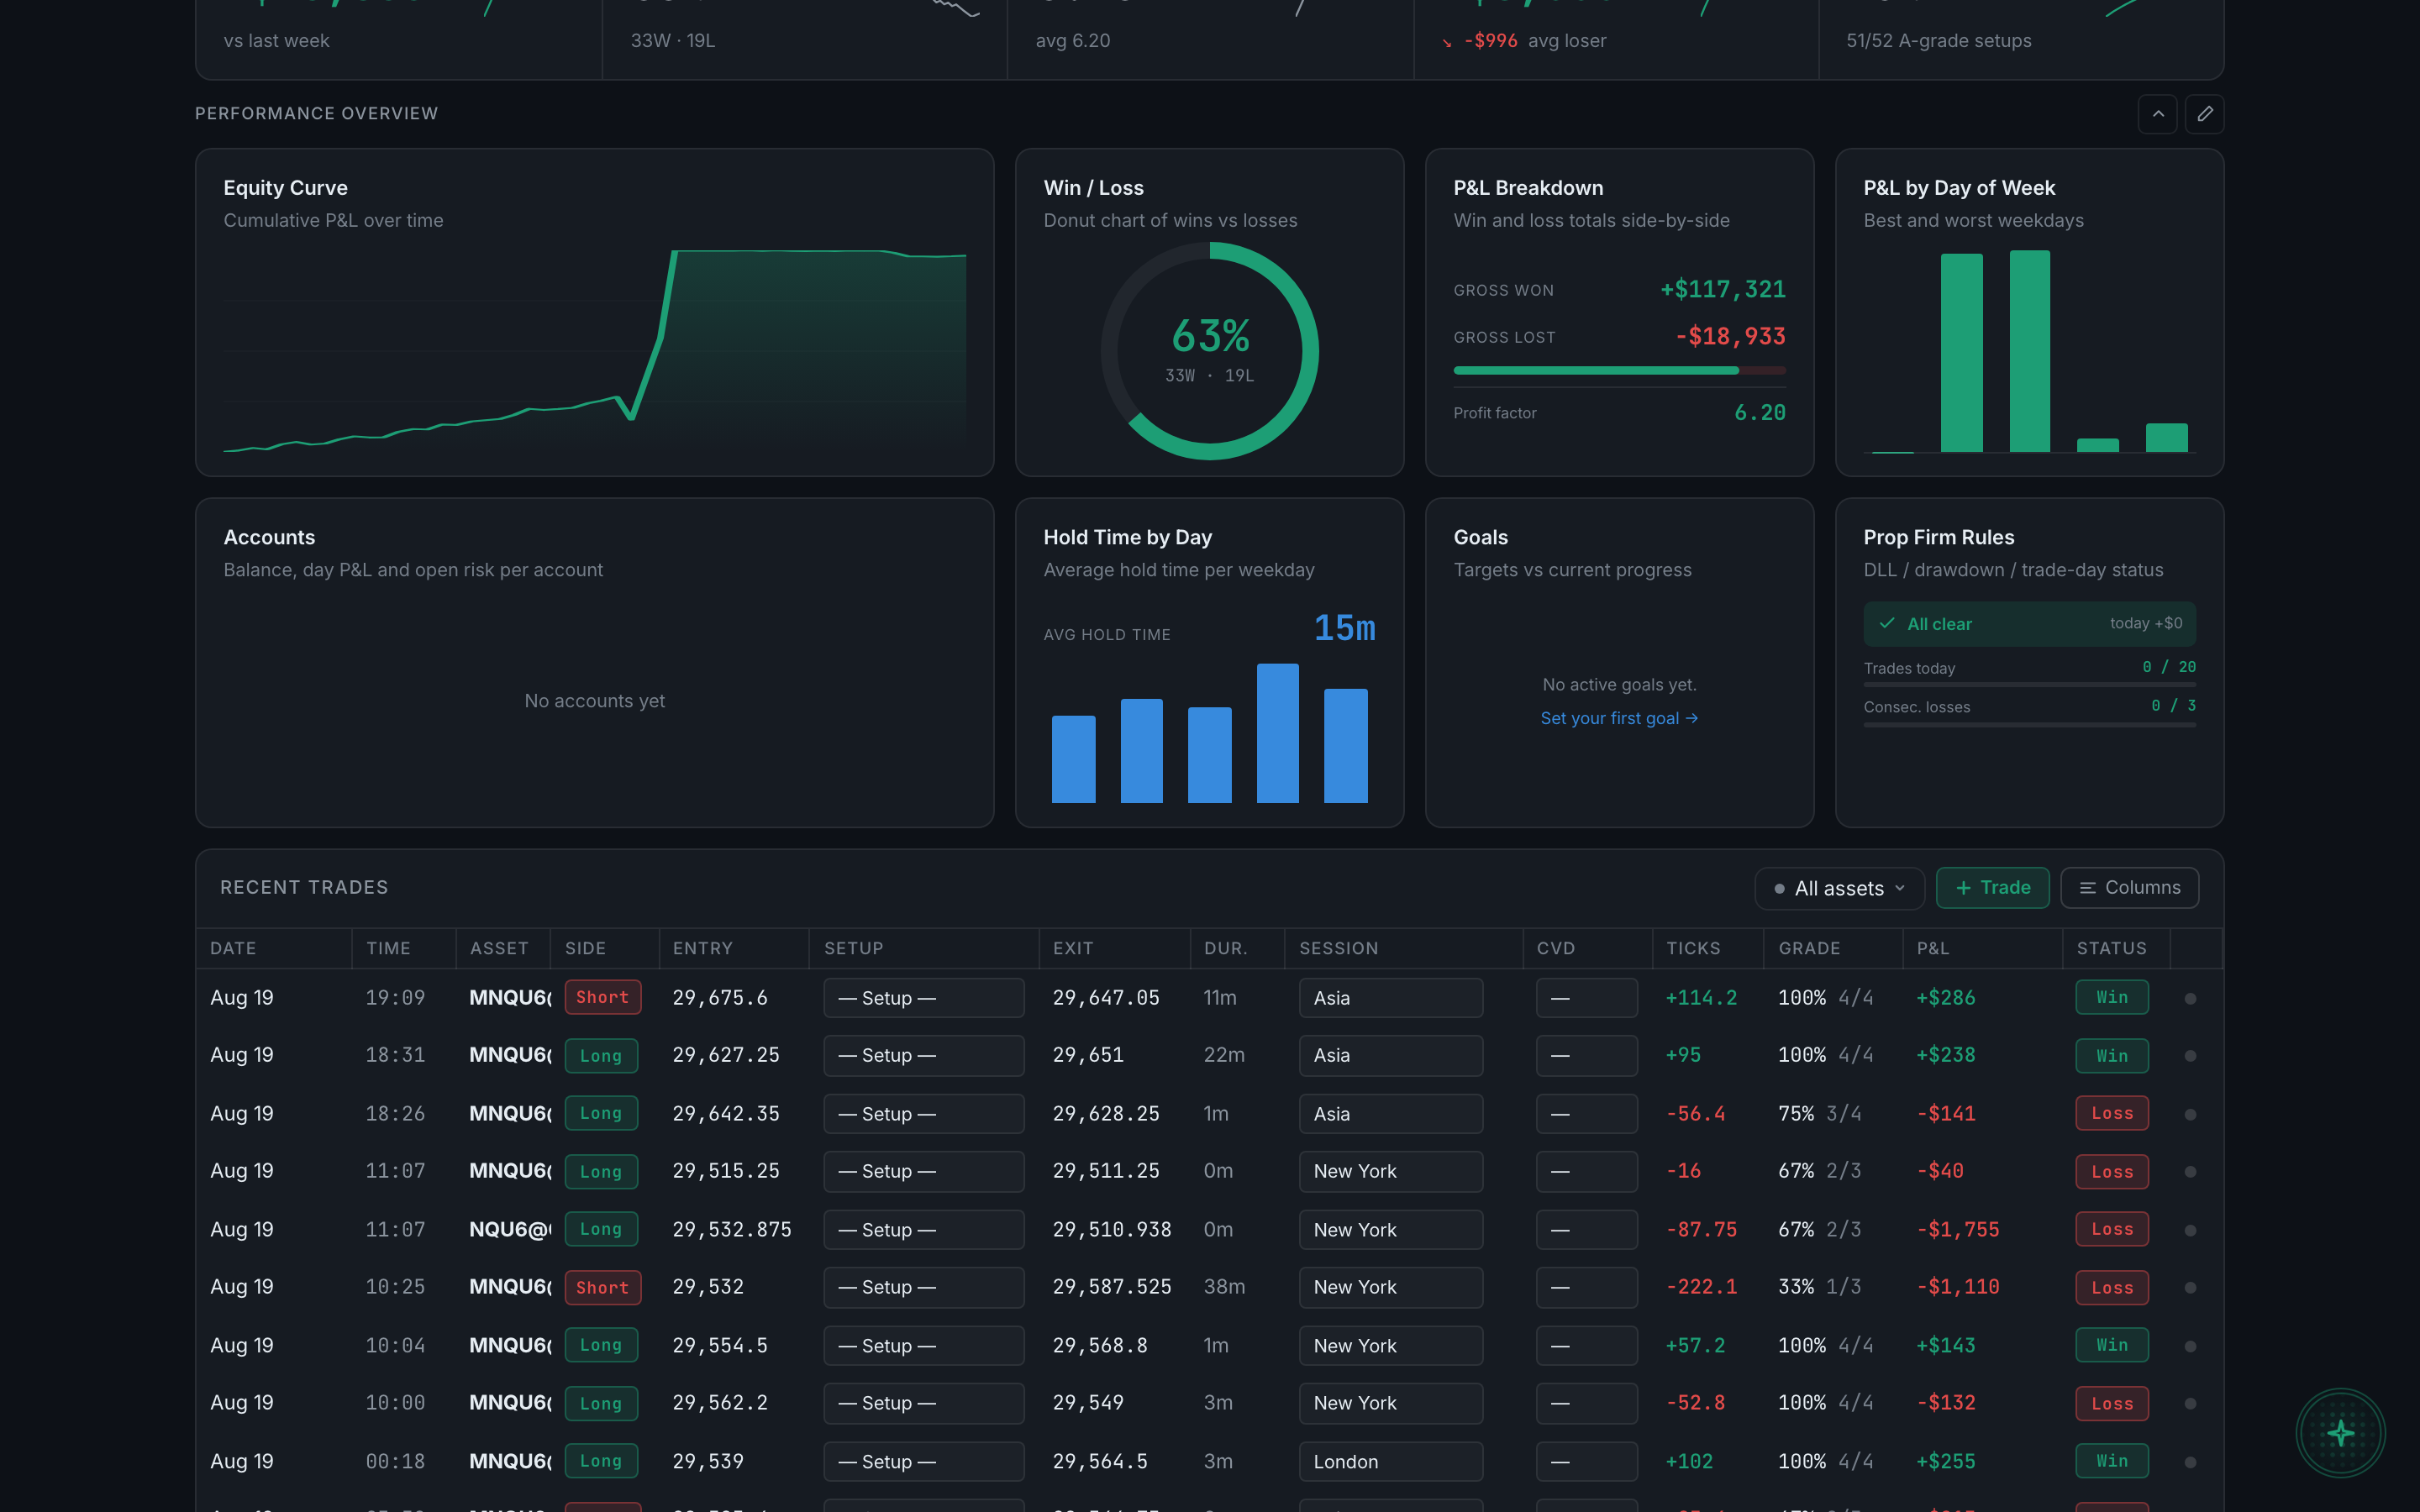
What is the Performance Overview grid?
The block of tiles under the stat strip. You choose which ones are there, how they are ordered, and how much of the grid is on screen.
The grid is the part of the Dashboard that is genuinely yours. The default set covers the things most traders want daily, but none of it is fixed, and a widget you never read is worth removing rather than scrolling past.
Each tile is a compact version of a bigger chart. Clicking one expands it into a pop-out with more room, and that pop-out carries its own timeframe pills.
Two controls sit at the right-hand end of the PERFORMANCE OVERVIEW heading, both icon-only:
- A chevron that collapses the grid to its first row and expands it again. Useful when you want the recent trades table closer to the top.
- A pencil — Edit layout — which is how you add, remove and rearrange tiles.