What is on the Dashboard?
Four things stacked down the page: a banner stack of anything urgent, a strip of five headline numbers, a grid of widgets you choose, and a recent trades table.
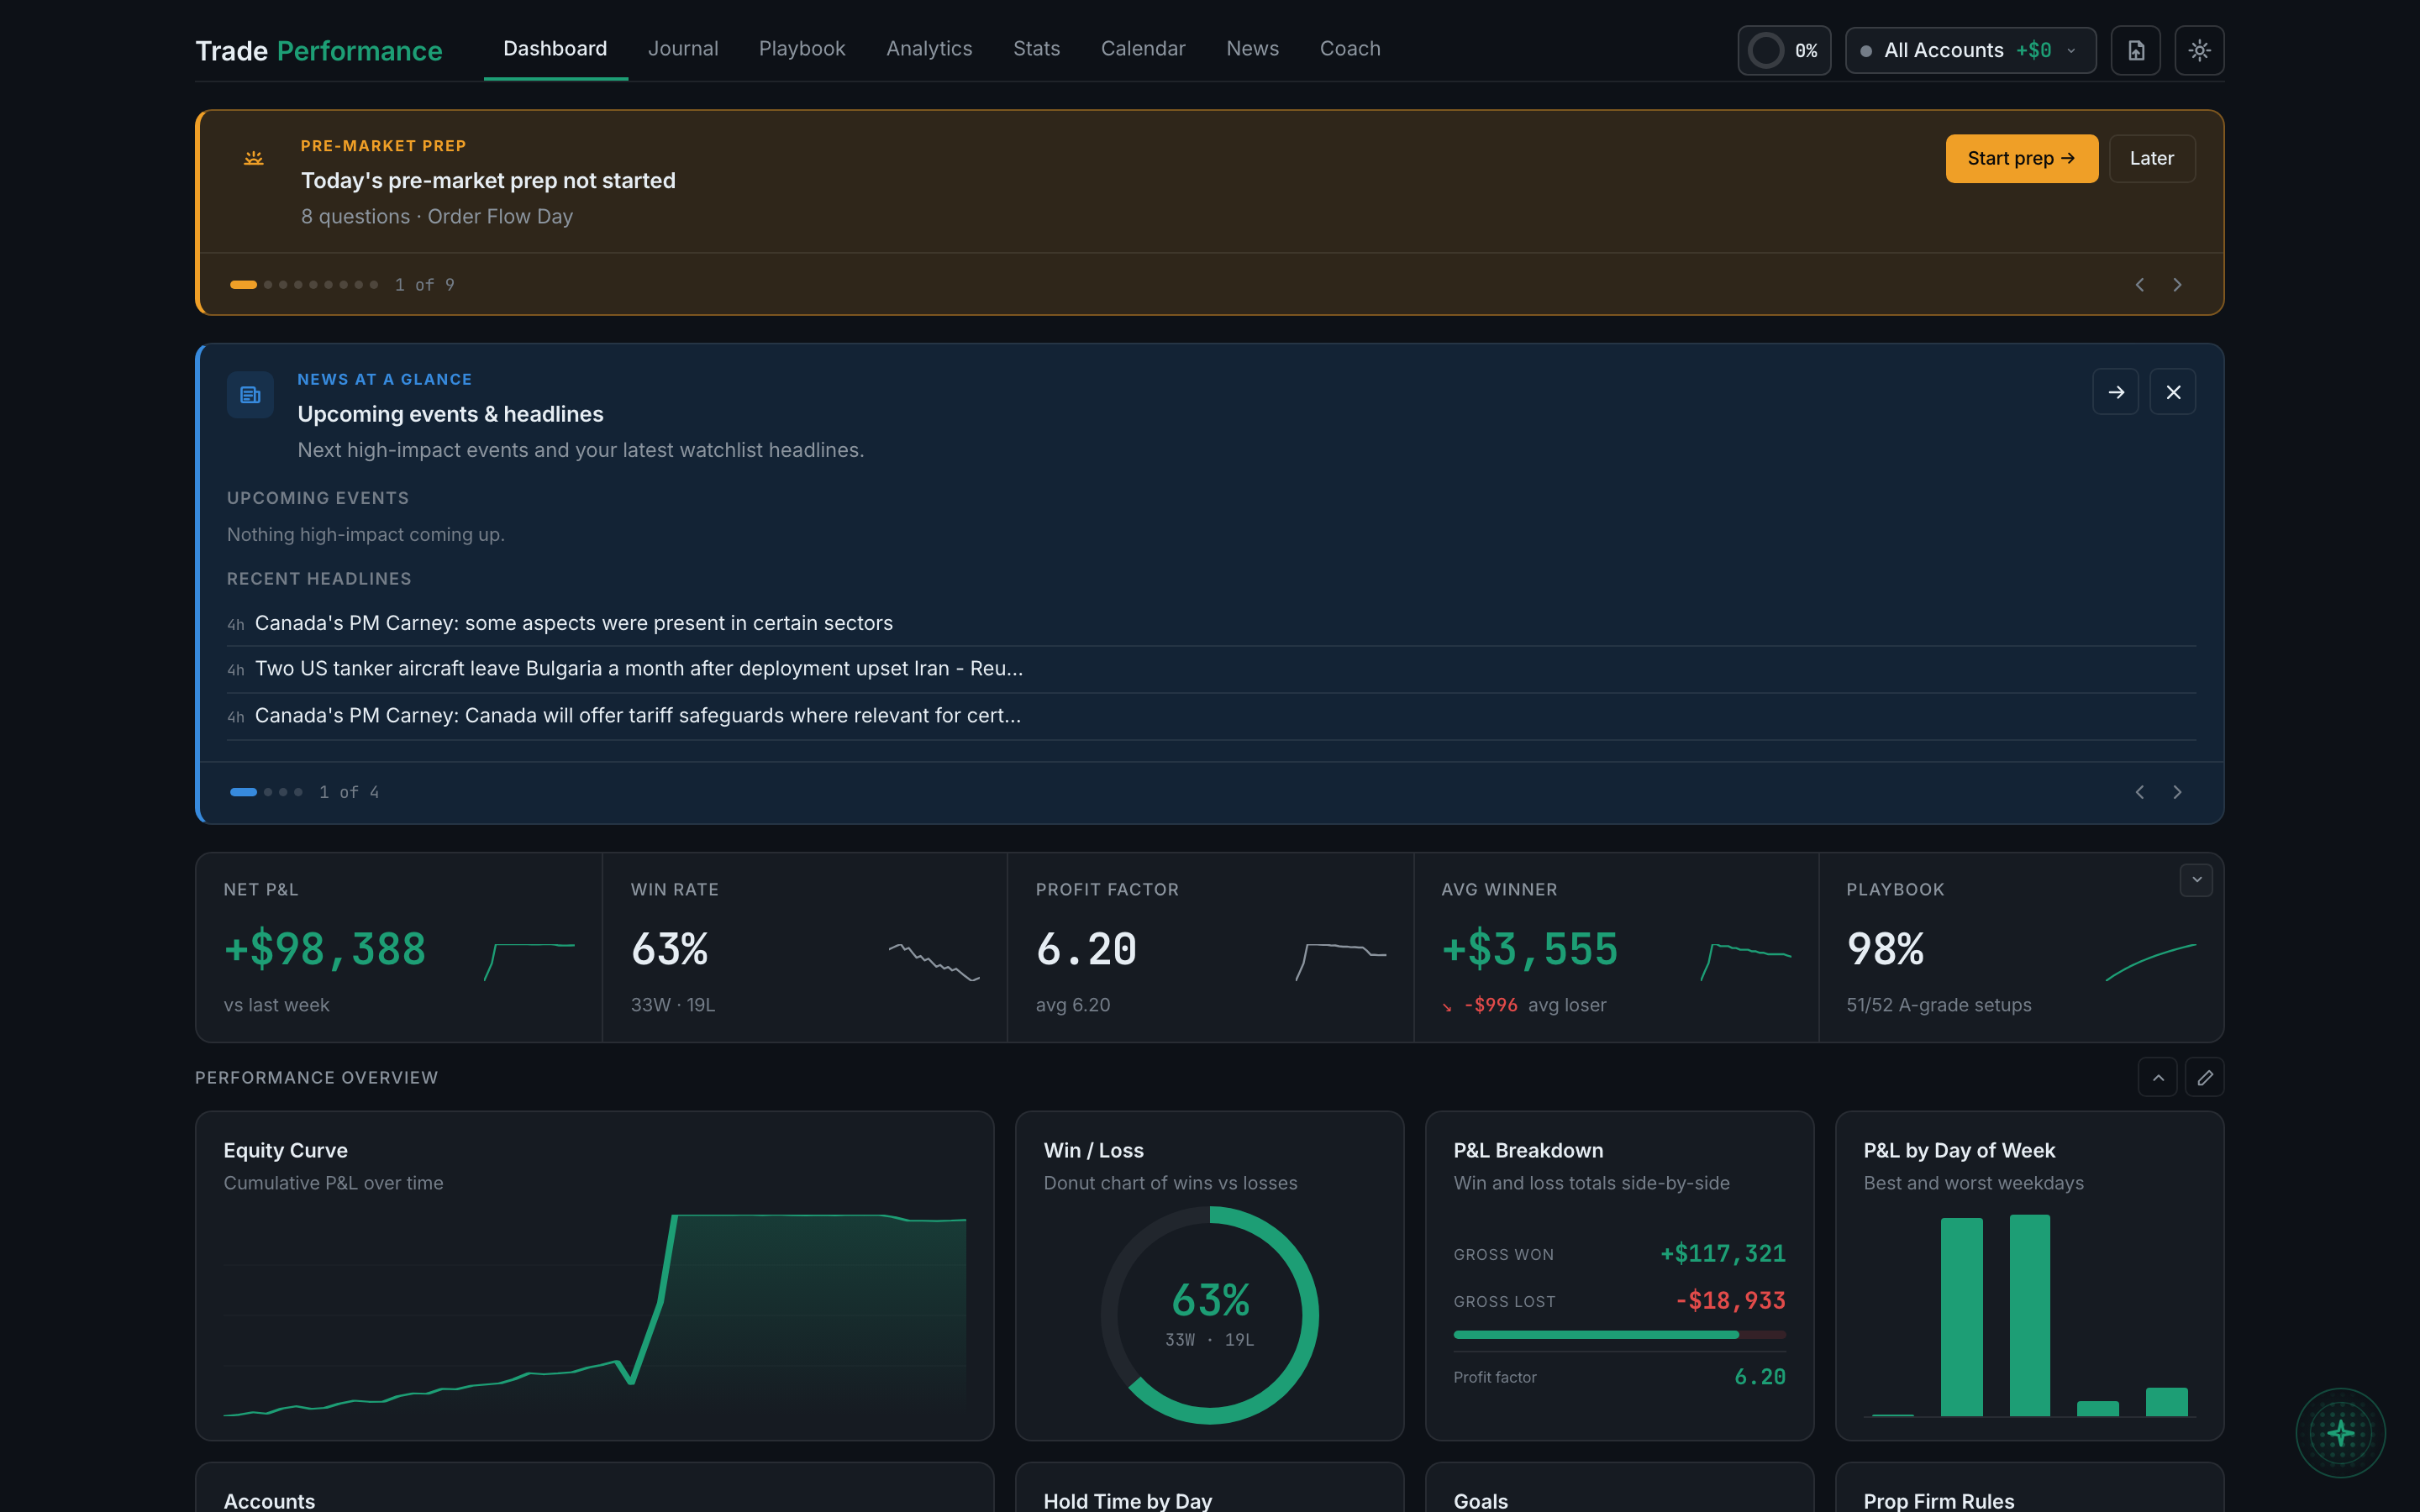
The first page you land on, and the one that answers "where do I stand, and is anything wrong right now?" without you having to go looking. Everything on it is built from trades you have already logged.
It reads top to bottom, roughly in order of how urgent things are.
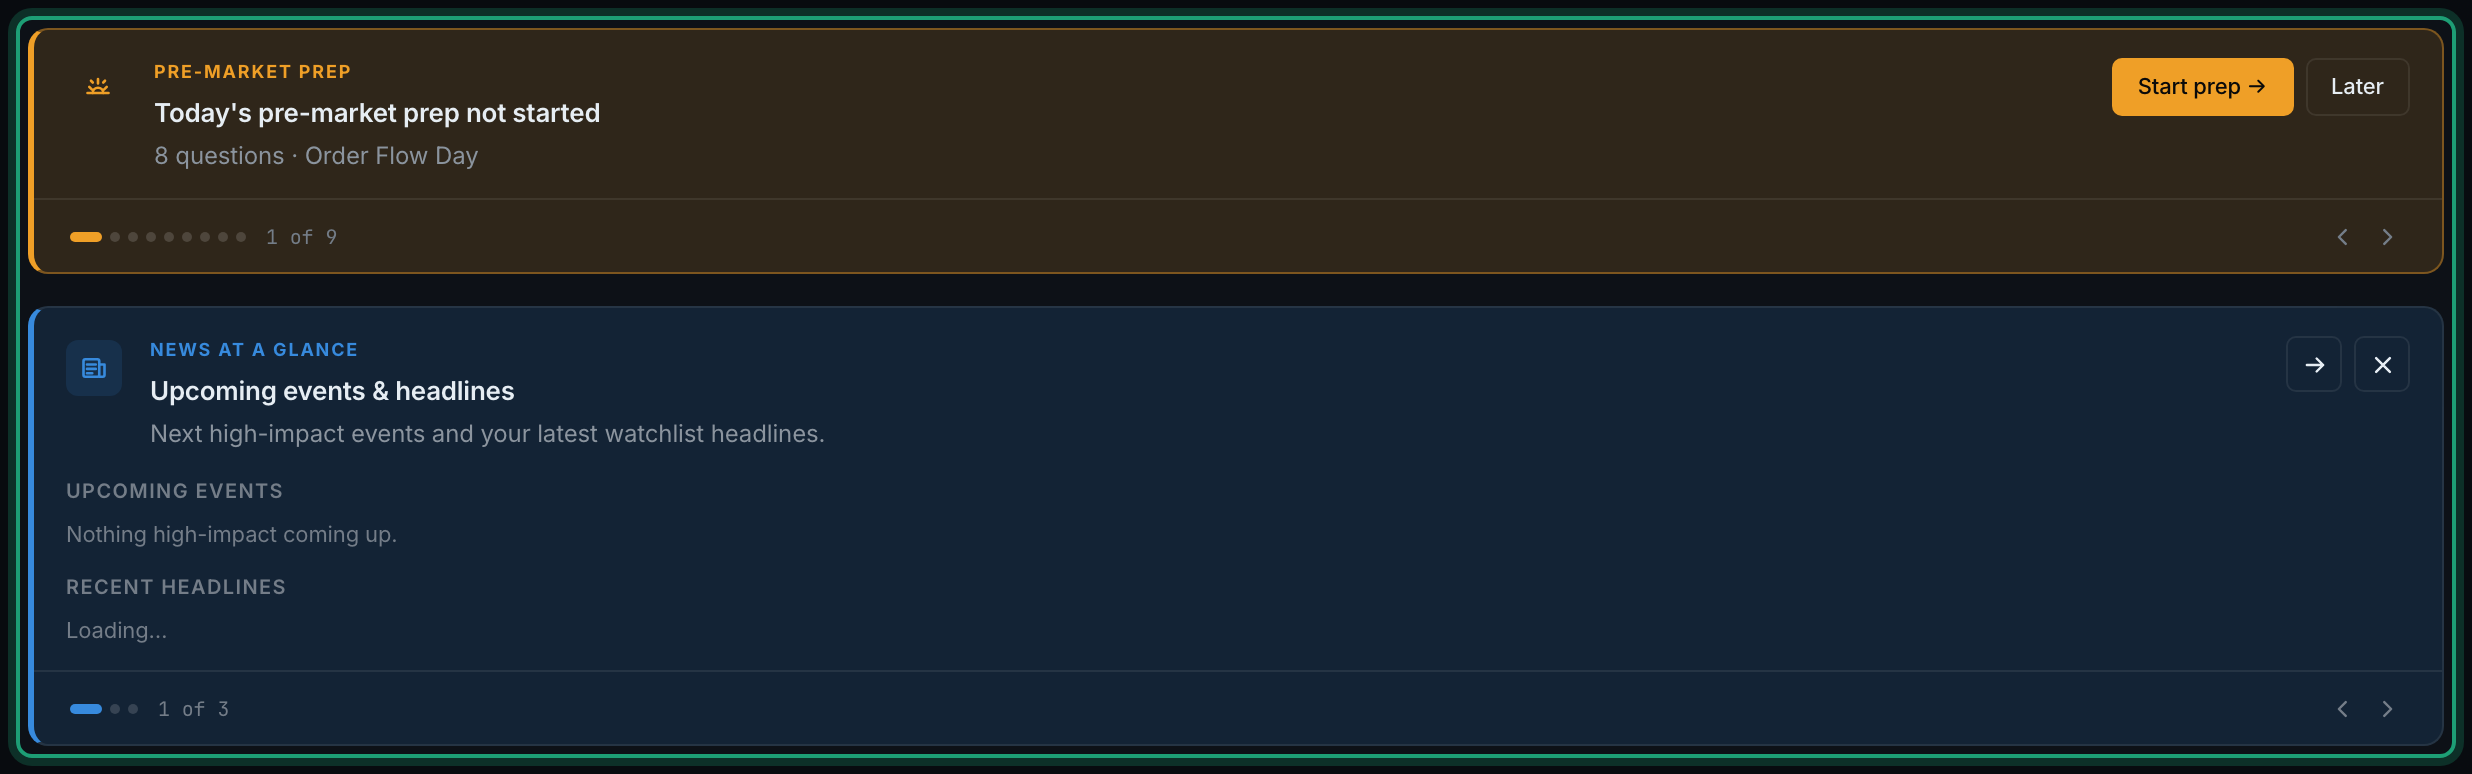
Anything time-critical is at the very top — a prop firm rule you are close to breaking, a high-impact news release about to land, the pre-market prep you have not done yet. Those appear as a stack of banners you page through.
Below that are the five numbers that describe your account as a whole, then a grid of widgets you choose and arrange yourself, and finally the most recent trades so you can jump straight into one.
Two things worth knowing before you start.
No questions on this page match that. Search all 15 areas
Four things stacked down the page: a banner stack of anything urgent, a strip of five headline numbers, a grid of widgets you choose, and a recent trades table.
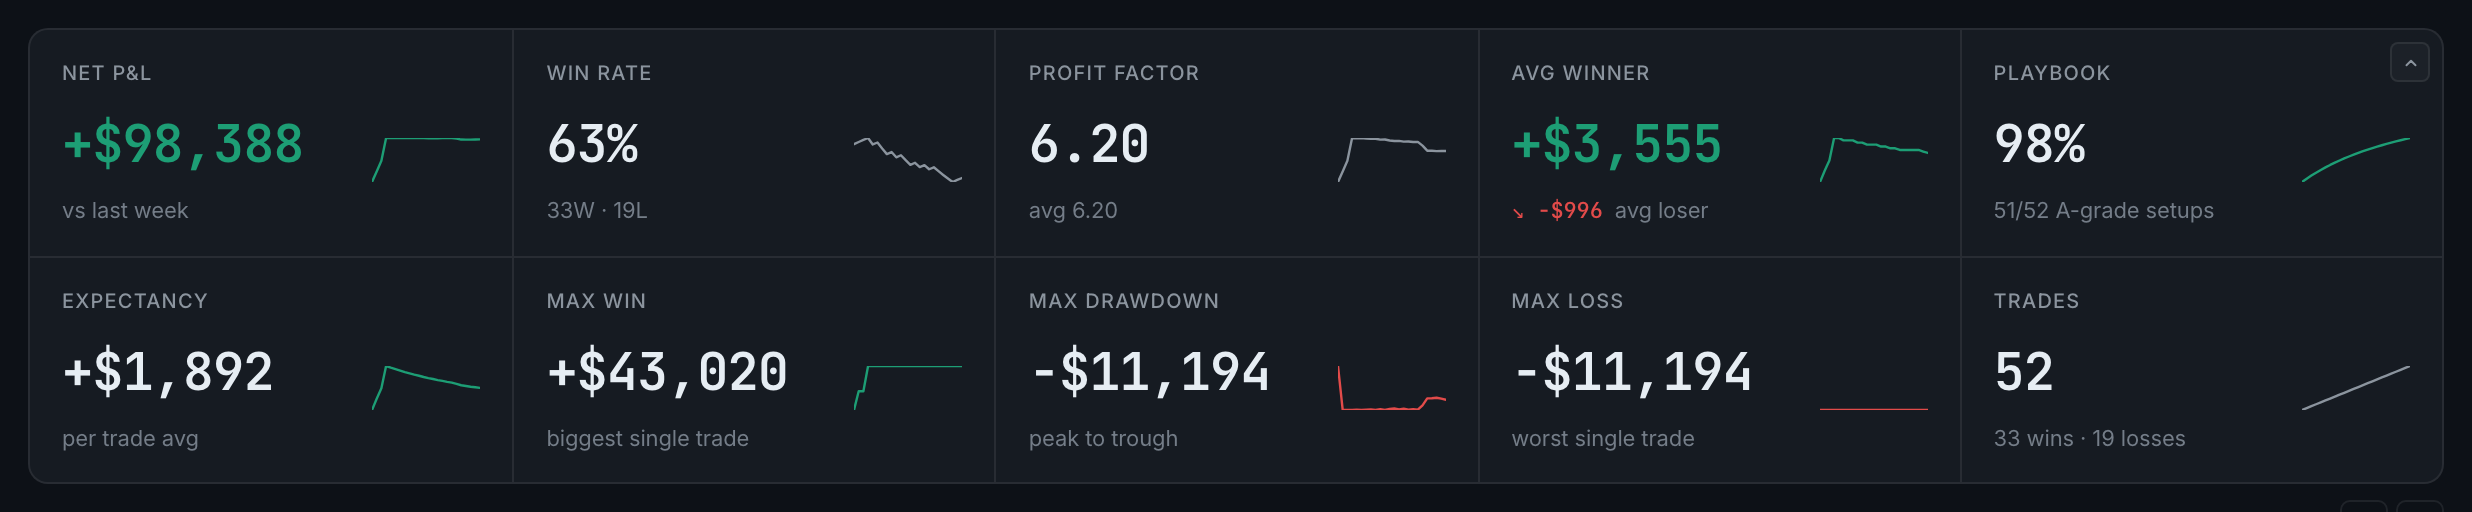
Net P&L, win rate, profit factor, average winner and your playbook adherence — each with a sparkline showing how it moved.

Yes. The small chevron at the right-hand end of the strip opens a second row of five more.
Not a clickable one. The page follows the filters you set elsewhere, and the only way to change its own timeframe is by voice.

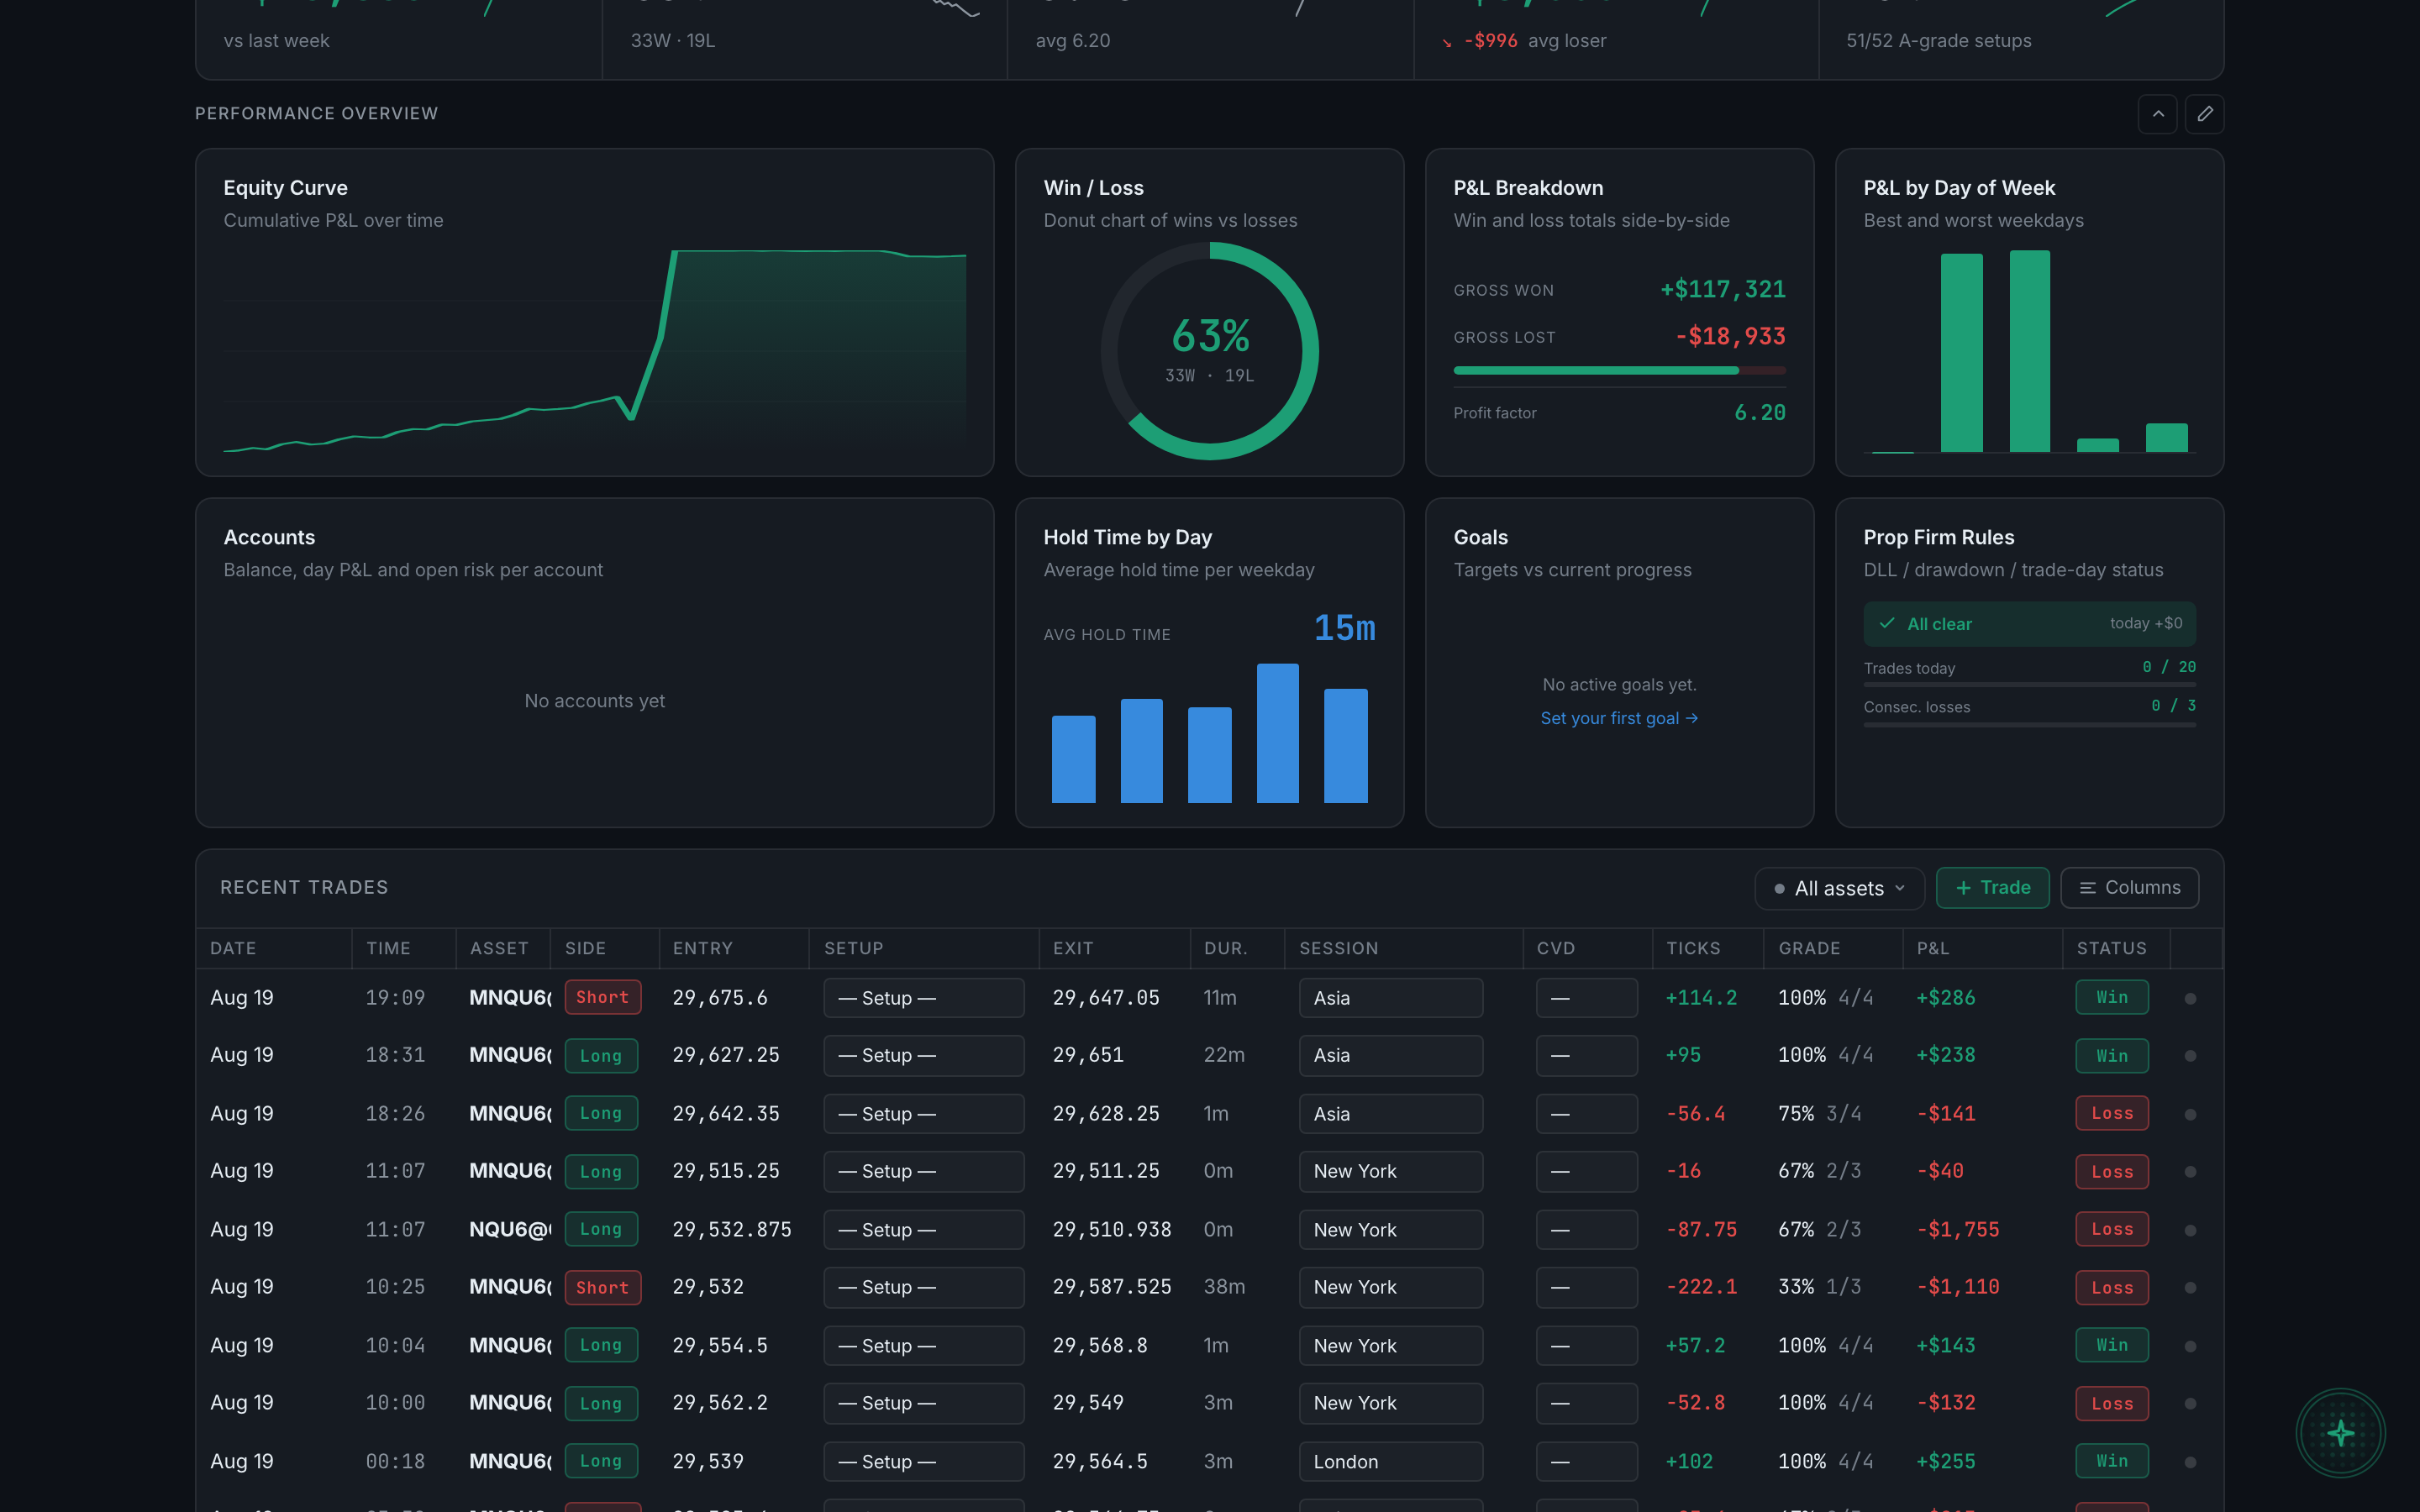
The block of tiles under the stat strip. You choose which ones are there, how they are ordered, and how much of the grid is on screen.
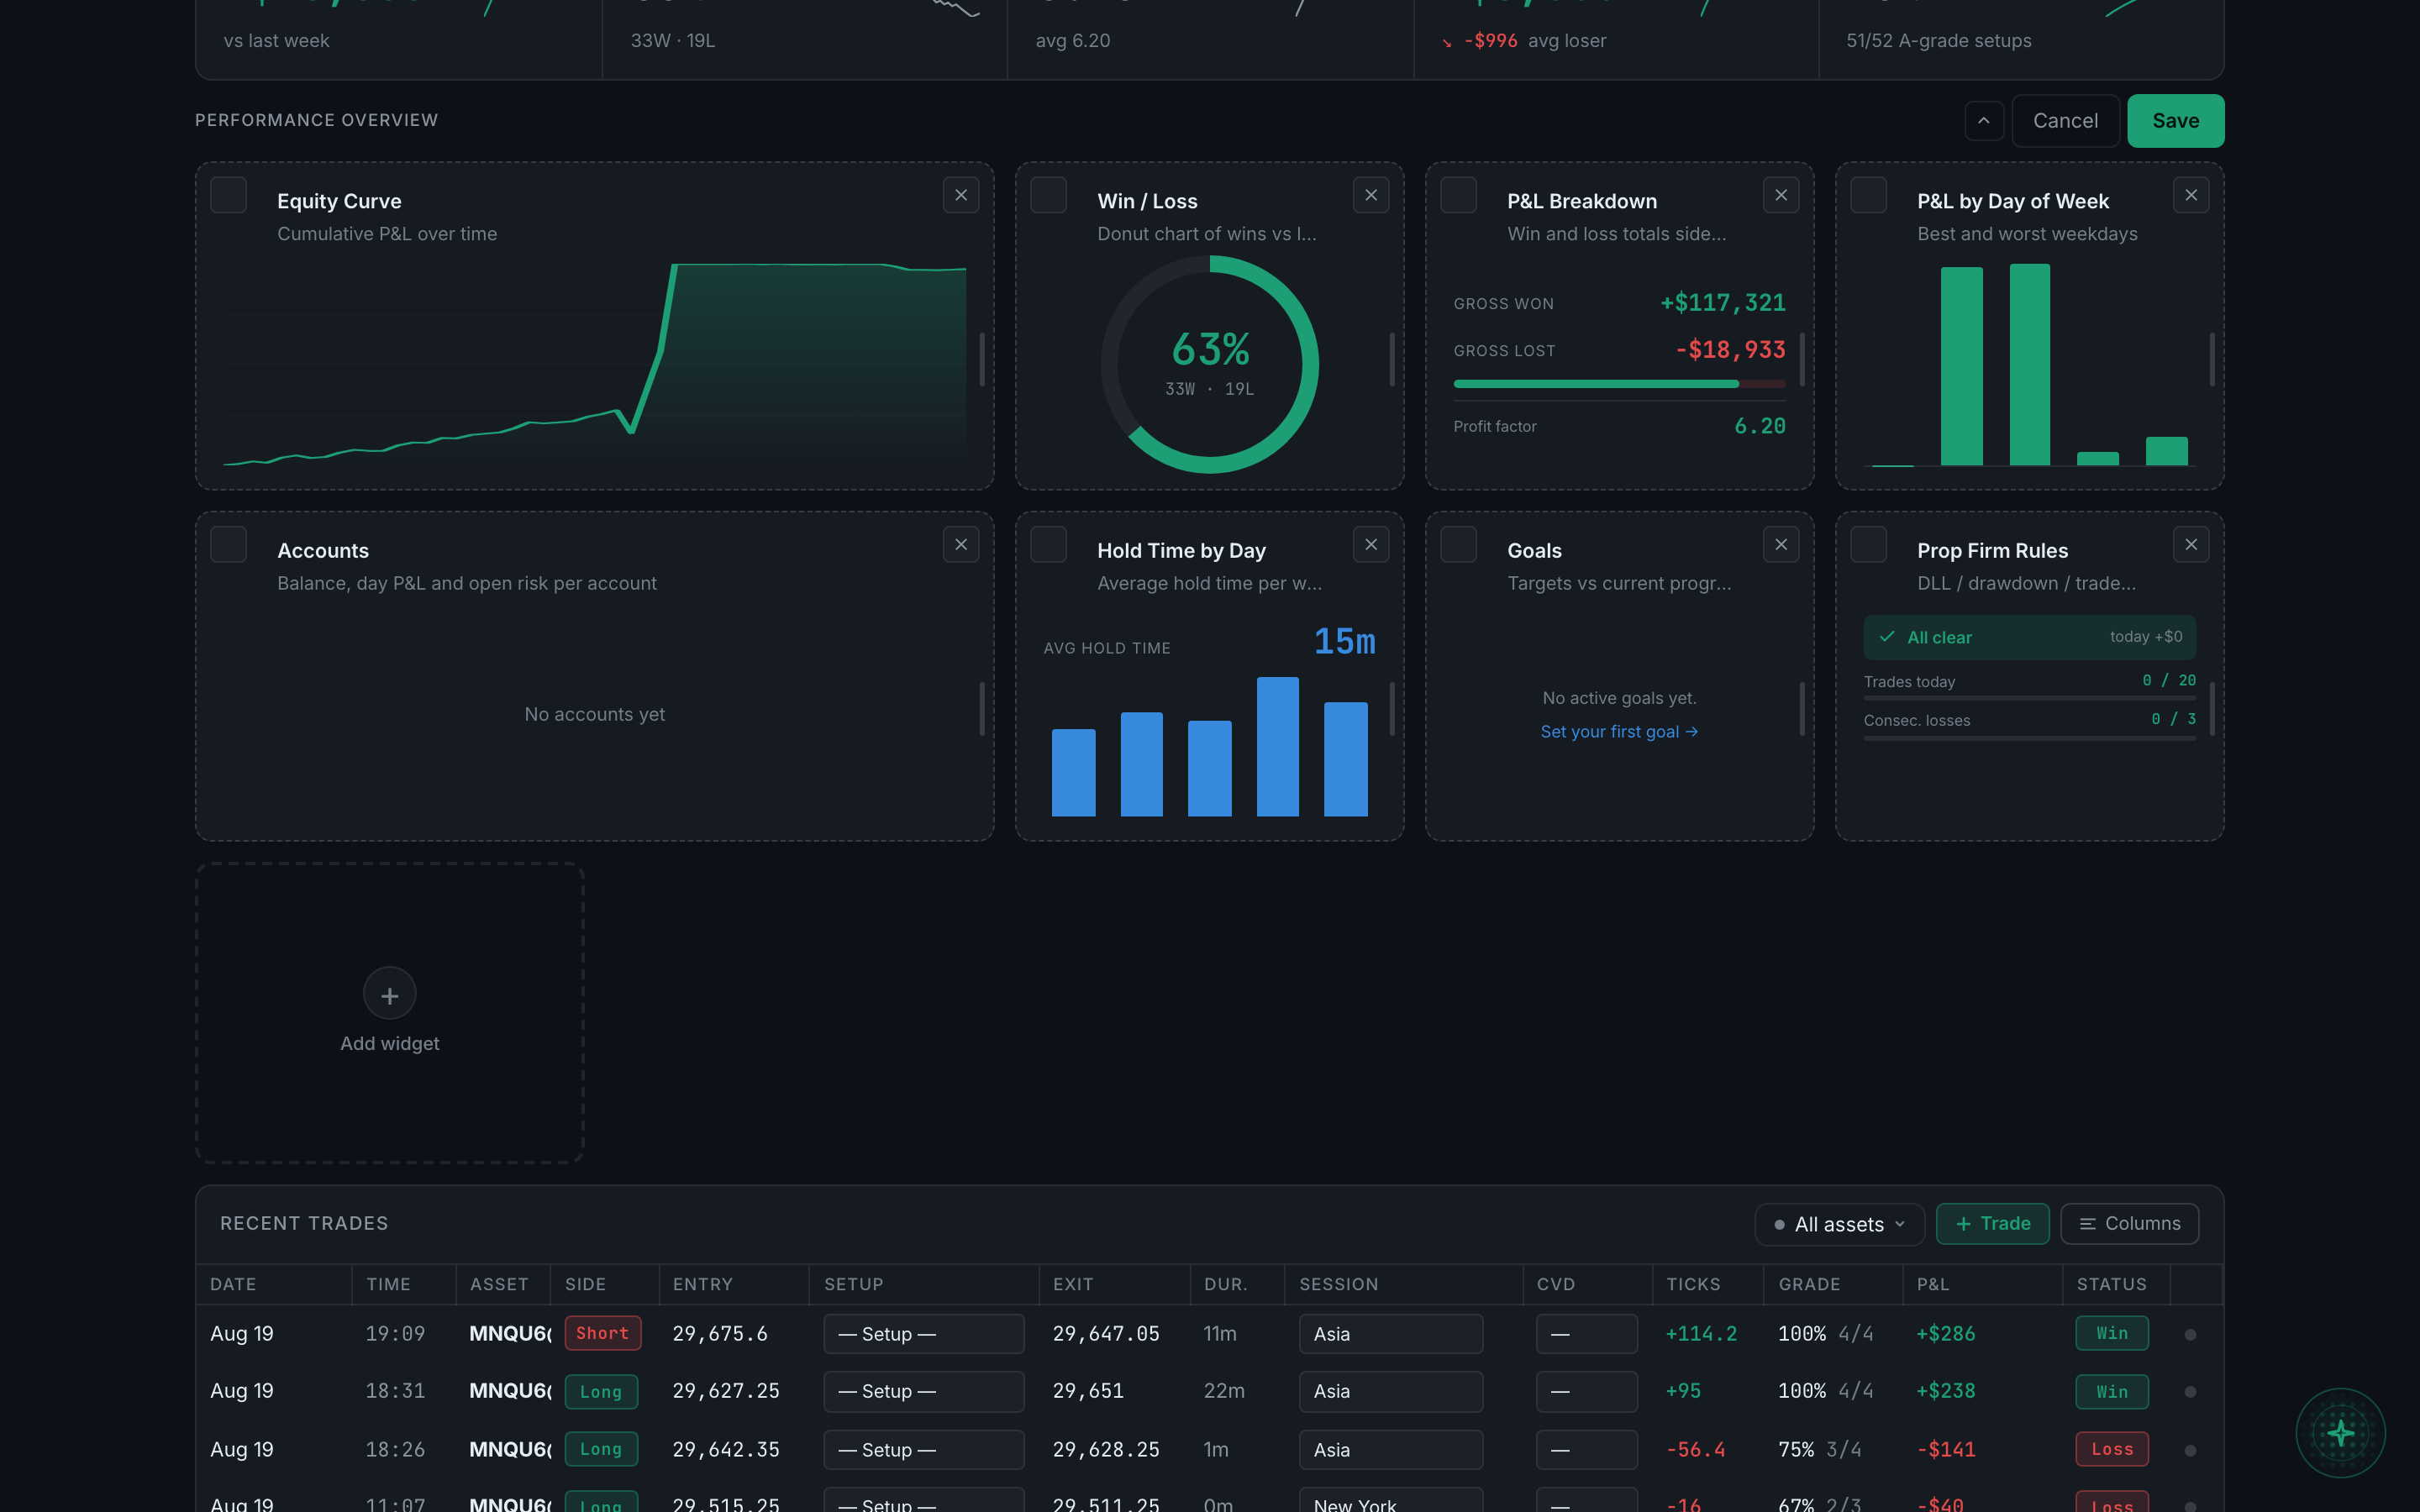
Click the Edit layout pencil. Tiles get a drag handle and an ✕, and an Add widget tile appears at the end. Then Save.
Fifteen, in five groups — Performance, Analytics, Execution, Psychology and Risk.
Read the full guideA queue of everything that wants your attention right now, shown one at a time with a count like "1 of 9" and arrows to page through.
Your broker says the position is flat, but the closing fills never reached TradePerformance. The trade is held out of your P&L until you enter the exit yourself.
Read the full guideAutomatic warnings about how you are behaving, not about how you are doing. Seven detectors run over your recent trades and speak up when one of them matches.

Sizing up after a loss, revenge trading, a losing streak, hitting your daily loss limit, off-playbook trades, sizing up against your own average, and trading outside your session.
The block at the foot of the Dashboard — your latest 20 trades, as a flat list, with its own filter, quick-add and column controls in its header.
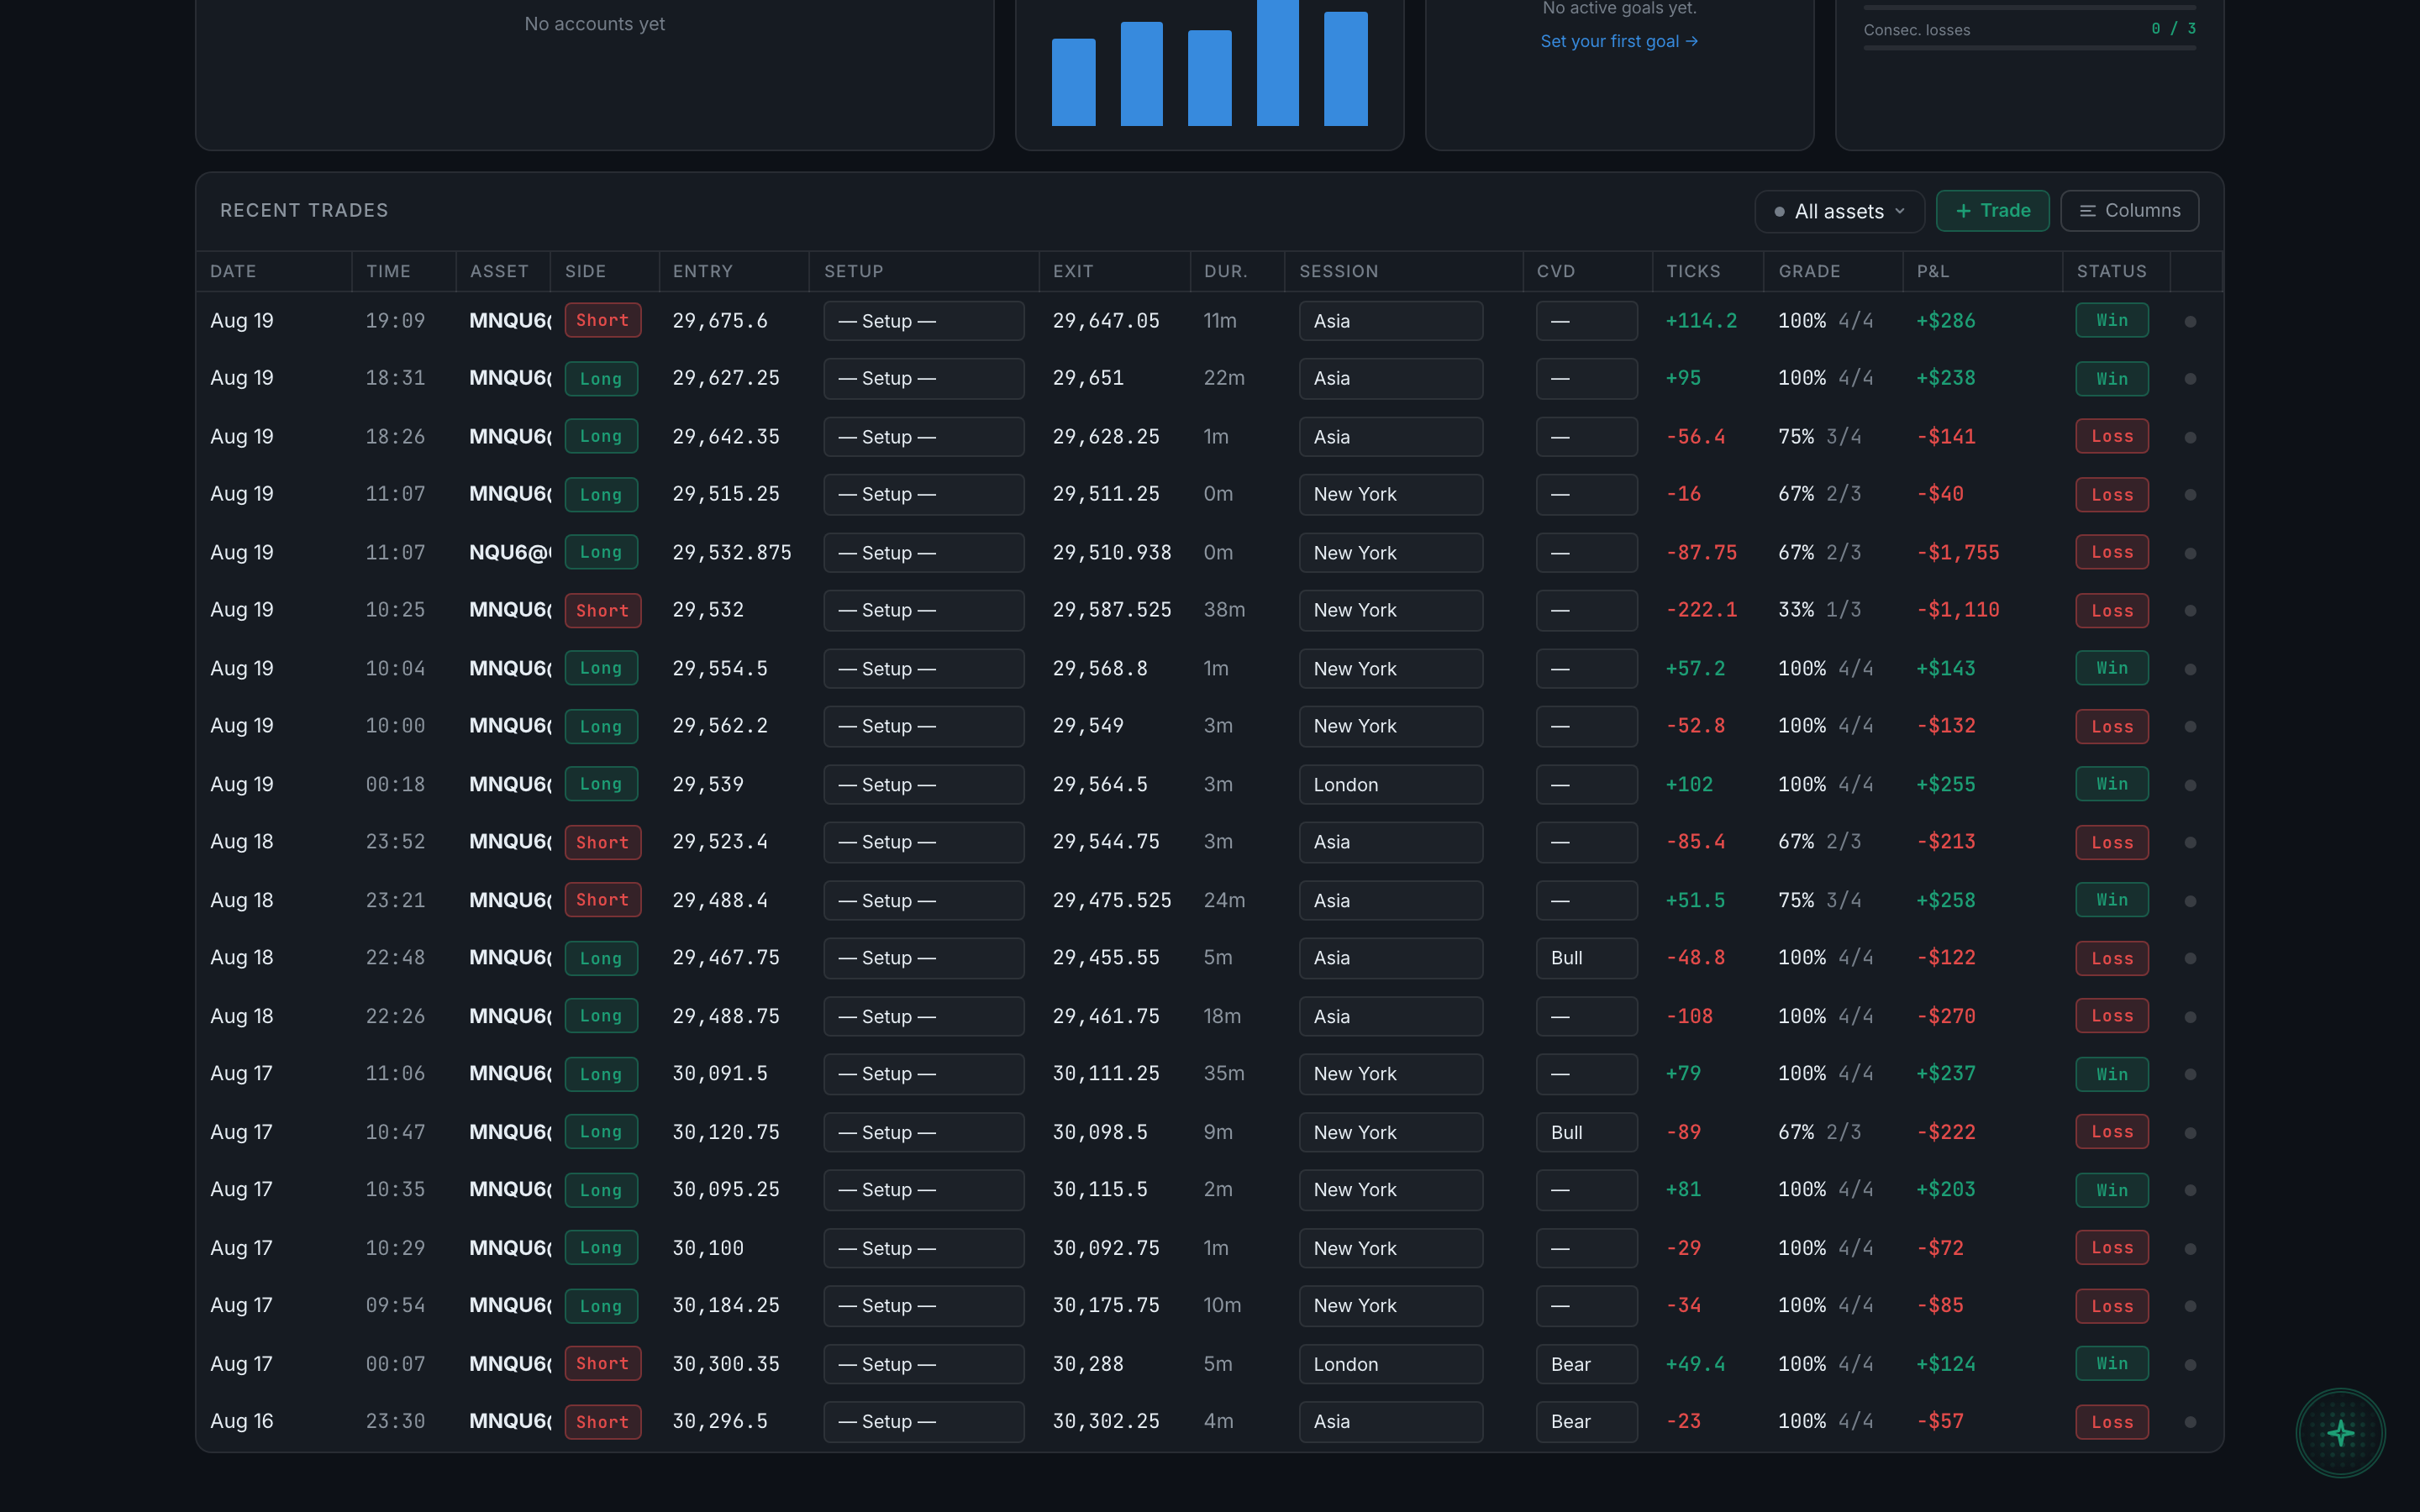
Click + Trade in the panel header. A one-line quick-add strip opens inside the header — this is not the Journal's full form.

Yes — Columns in the panel header. It is the same chooser as the Journal, and the choice applies to both.

Yes, by instrument — the All assets button, the same popover the Journal uses, including its Apply step.

Click anywhere on its row in Recent trades. The full detail panel opens at the foot of the panel, below the last row, without leaving the Dashboard.

Chart replay, Snapshot, Trade details and Notes — one for what the market did, one for your pictures, one for the numbers and context, one for what you thought.
