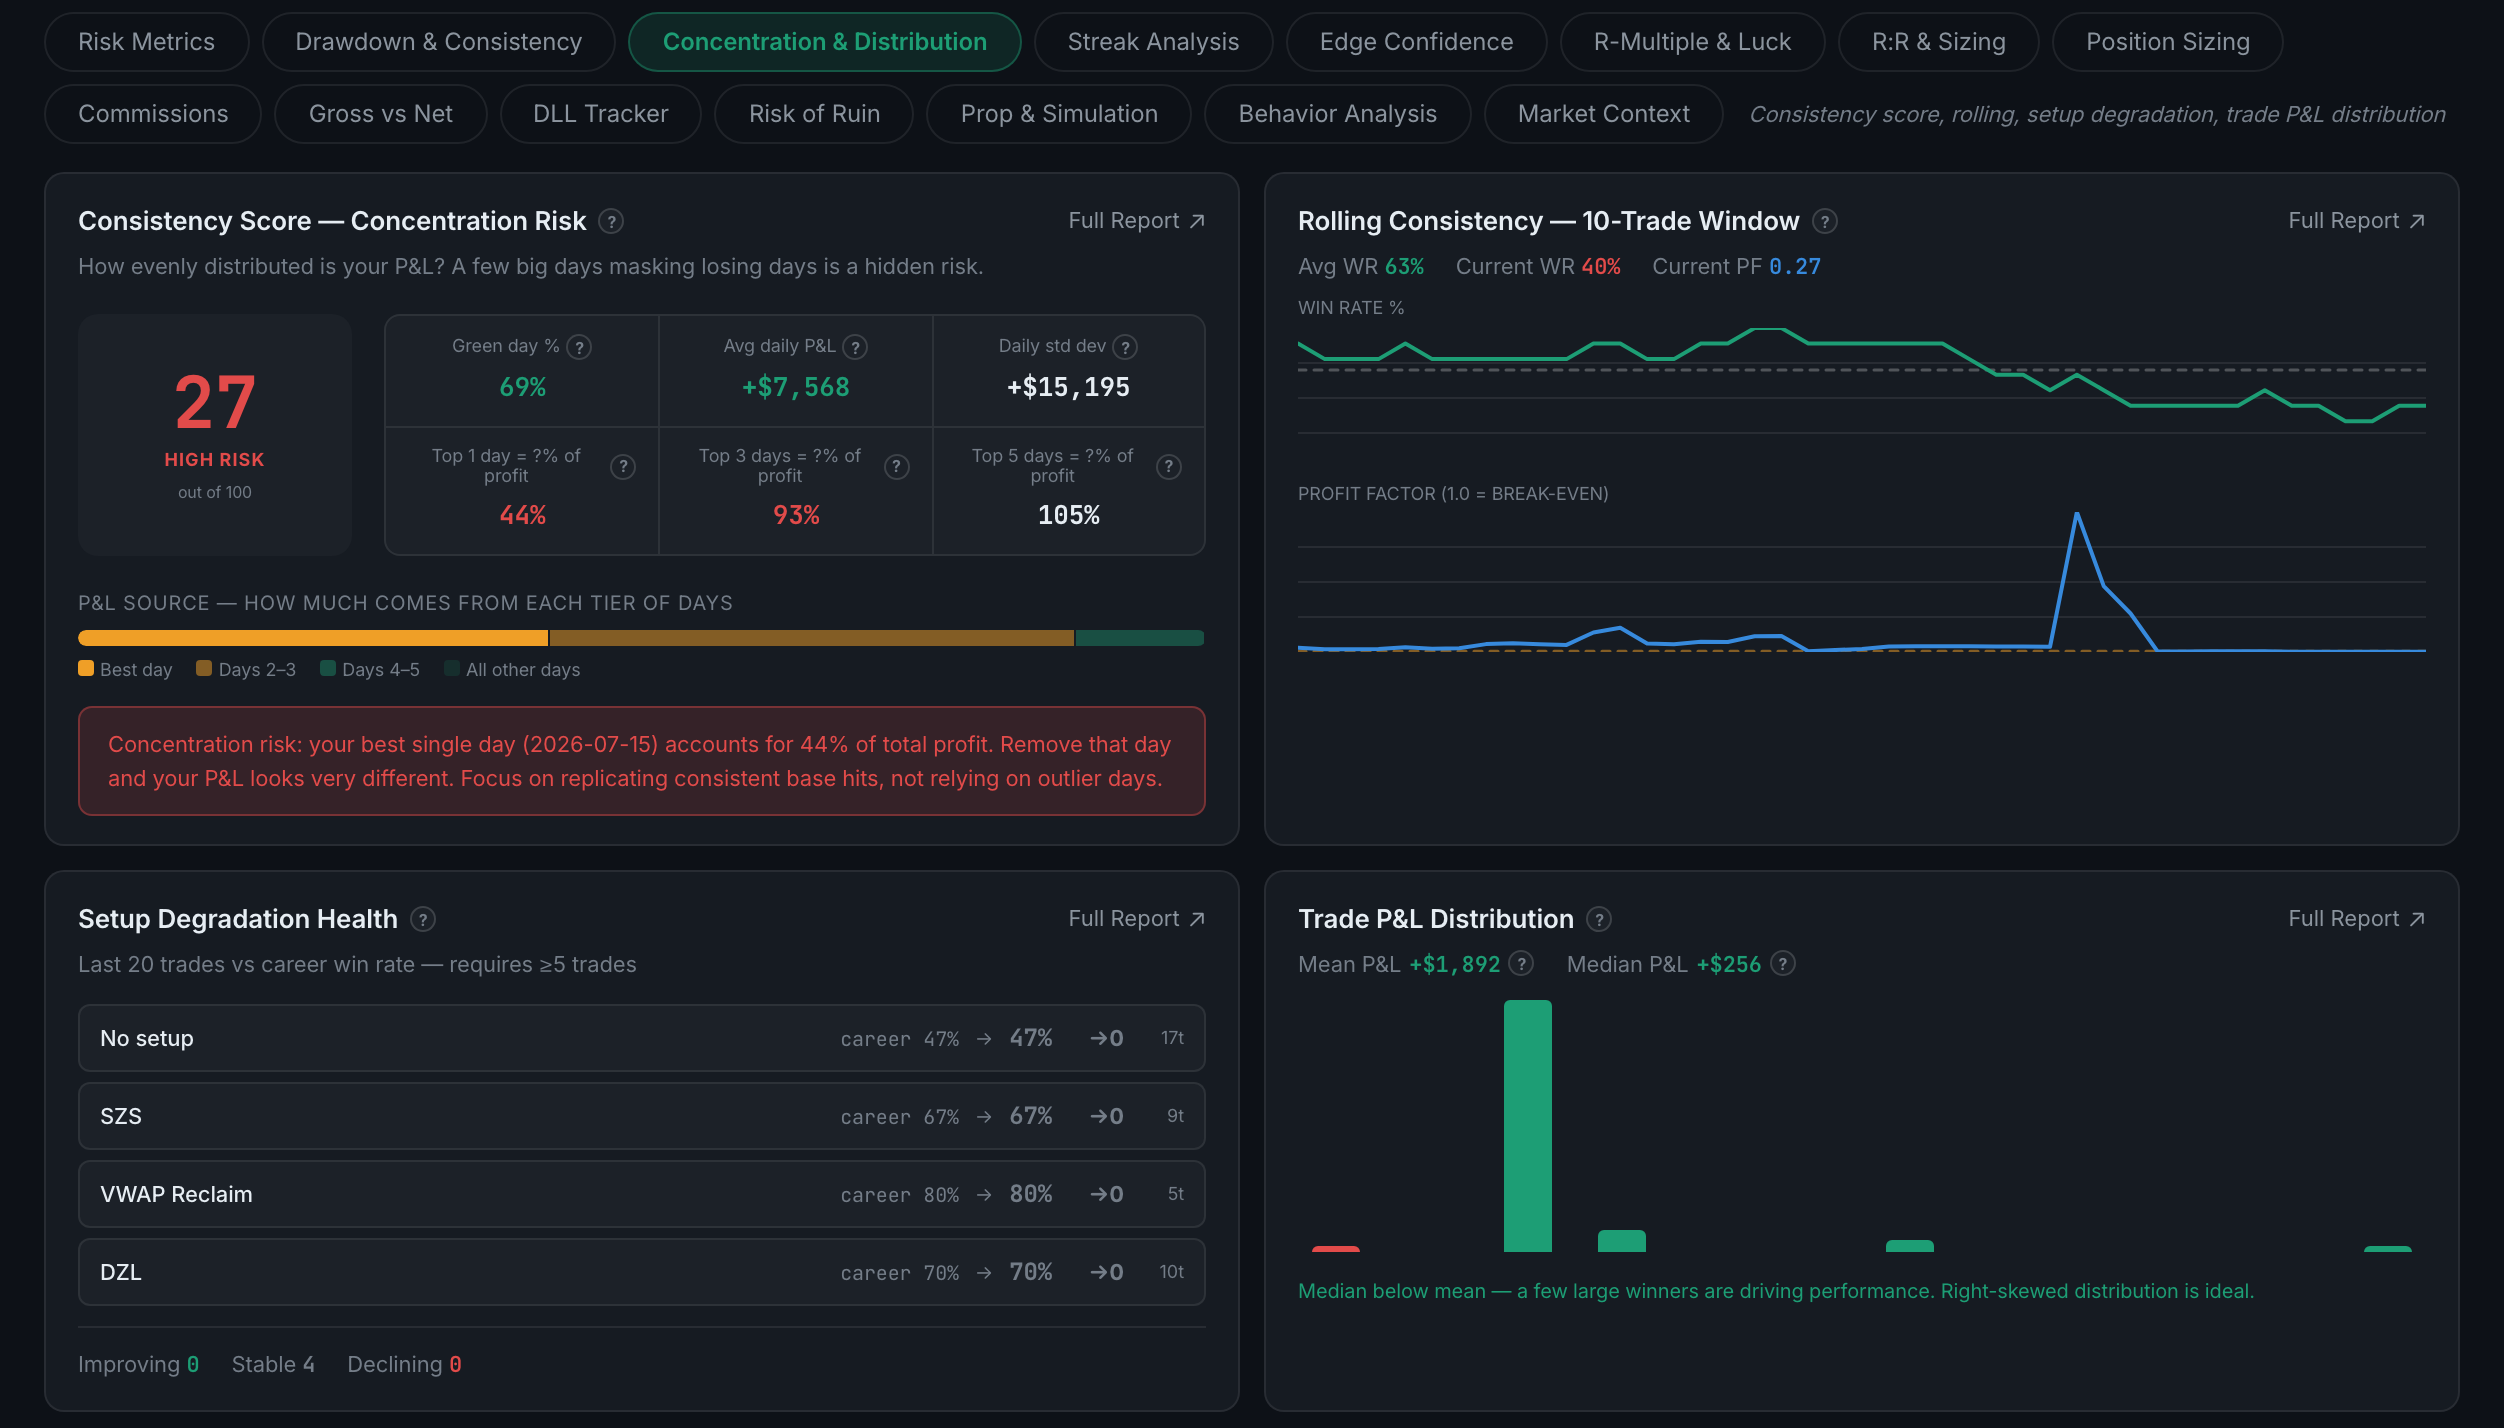
What is on the Concentration & Distribution sub-page?
Whether your profit comes from everywhere or from one place — a concentration score, rolling consistency, setup degradation, and the shape of your P&L distribution.
The question here is fragility. Two accounts with the same total can be built very differently, and the one whose profit depends on a single setup or a single week is one change of market away from a very different result.
Indicators on this sub-page:
- Consistency Score — Concentration RiskA 0–100 score with a risk band, beside green-day percentage, average daily P&L and daily standard deviation. Then the figures that make the point: what share of your total profit came from your top one day, your top three and your top five, and a stacked bar showing how much comes from each tier. It closes by naming the date of your best day and what removing it would do. A top-five share above 100% means every other day, netted, lost money.
- Rolling Consistency — 10-Trade WindowYour win rate and profit factor over a moving window, plotted against your average, with your current figures called out. The break-even line on the profit factor chart is drawn at 1.0. Needs at least five trades.
- Setup Degradation HealthEach setup's career win rate against its recent win rate, with the change and a trade count, then a tally of how many setups are improving, stable or declining. This is the panel that catches a setup that quietly stopped working.
- Trade P&L DistributionThe shape of your outcomes with mean and median stated above it. The reading is underneath, and it is a good one: a median below the mean means a few large winners are carrying the account, which is right-skewed and is what you want.