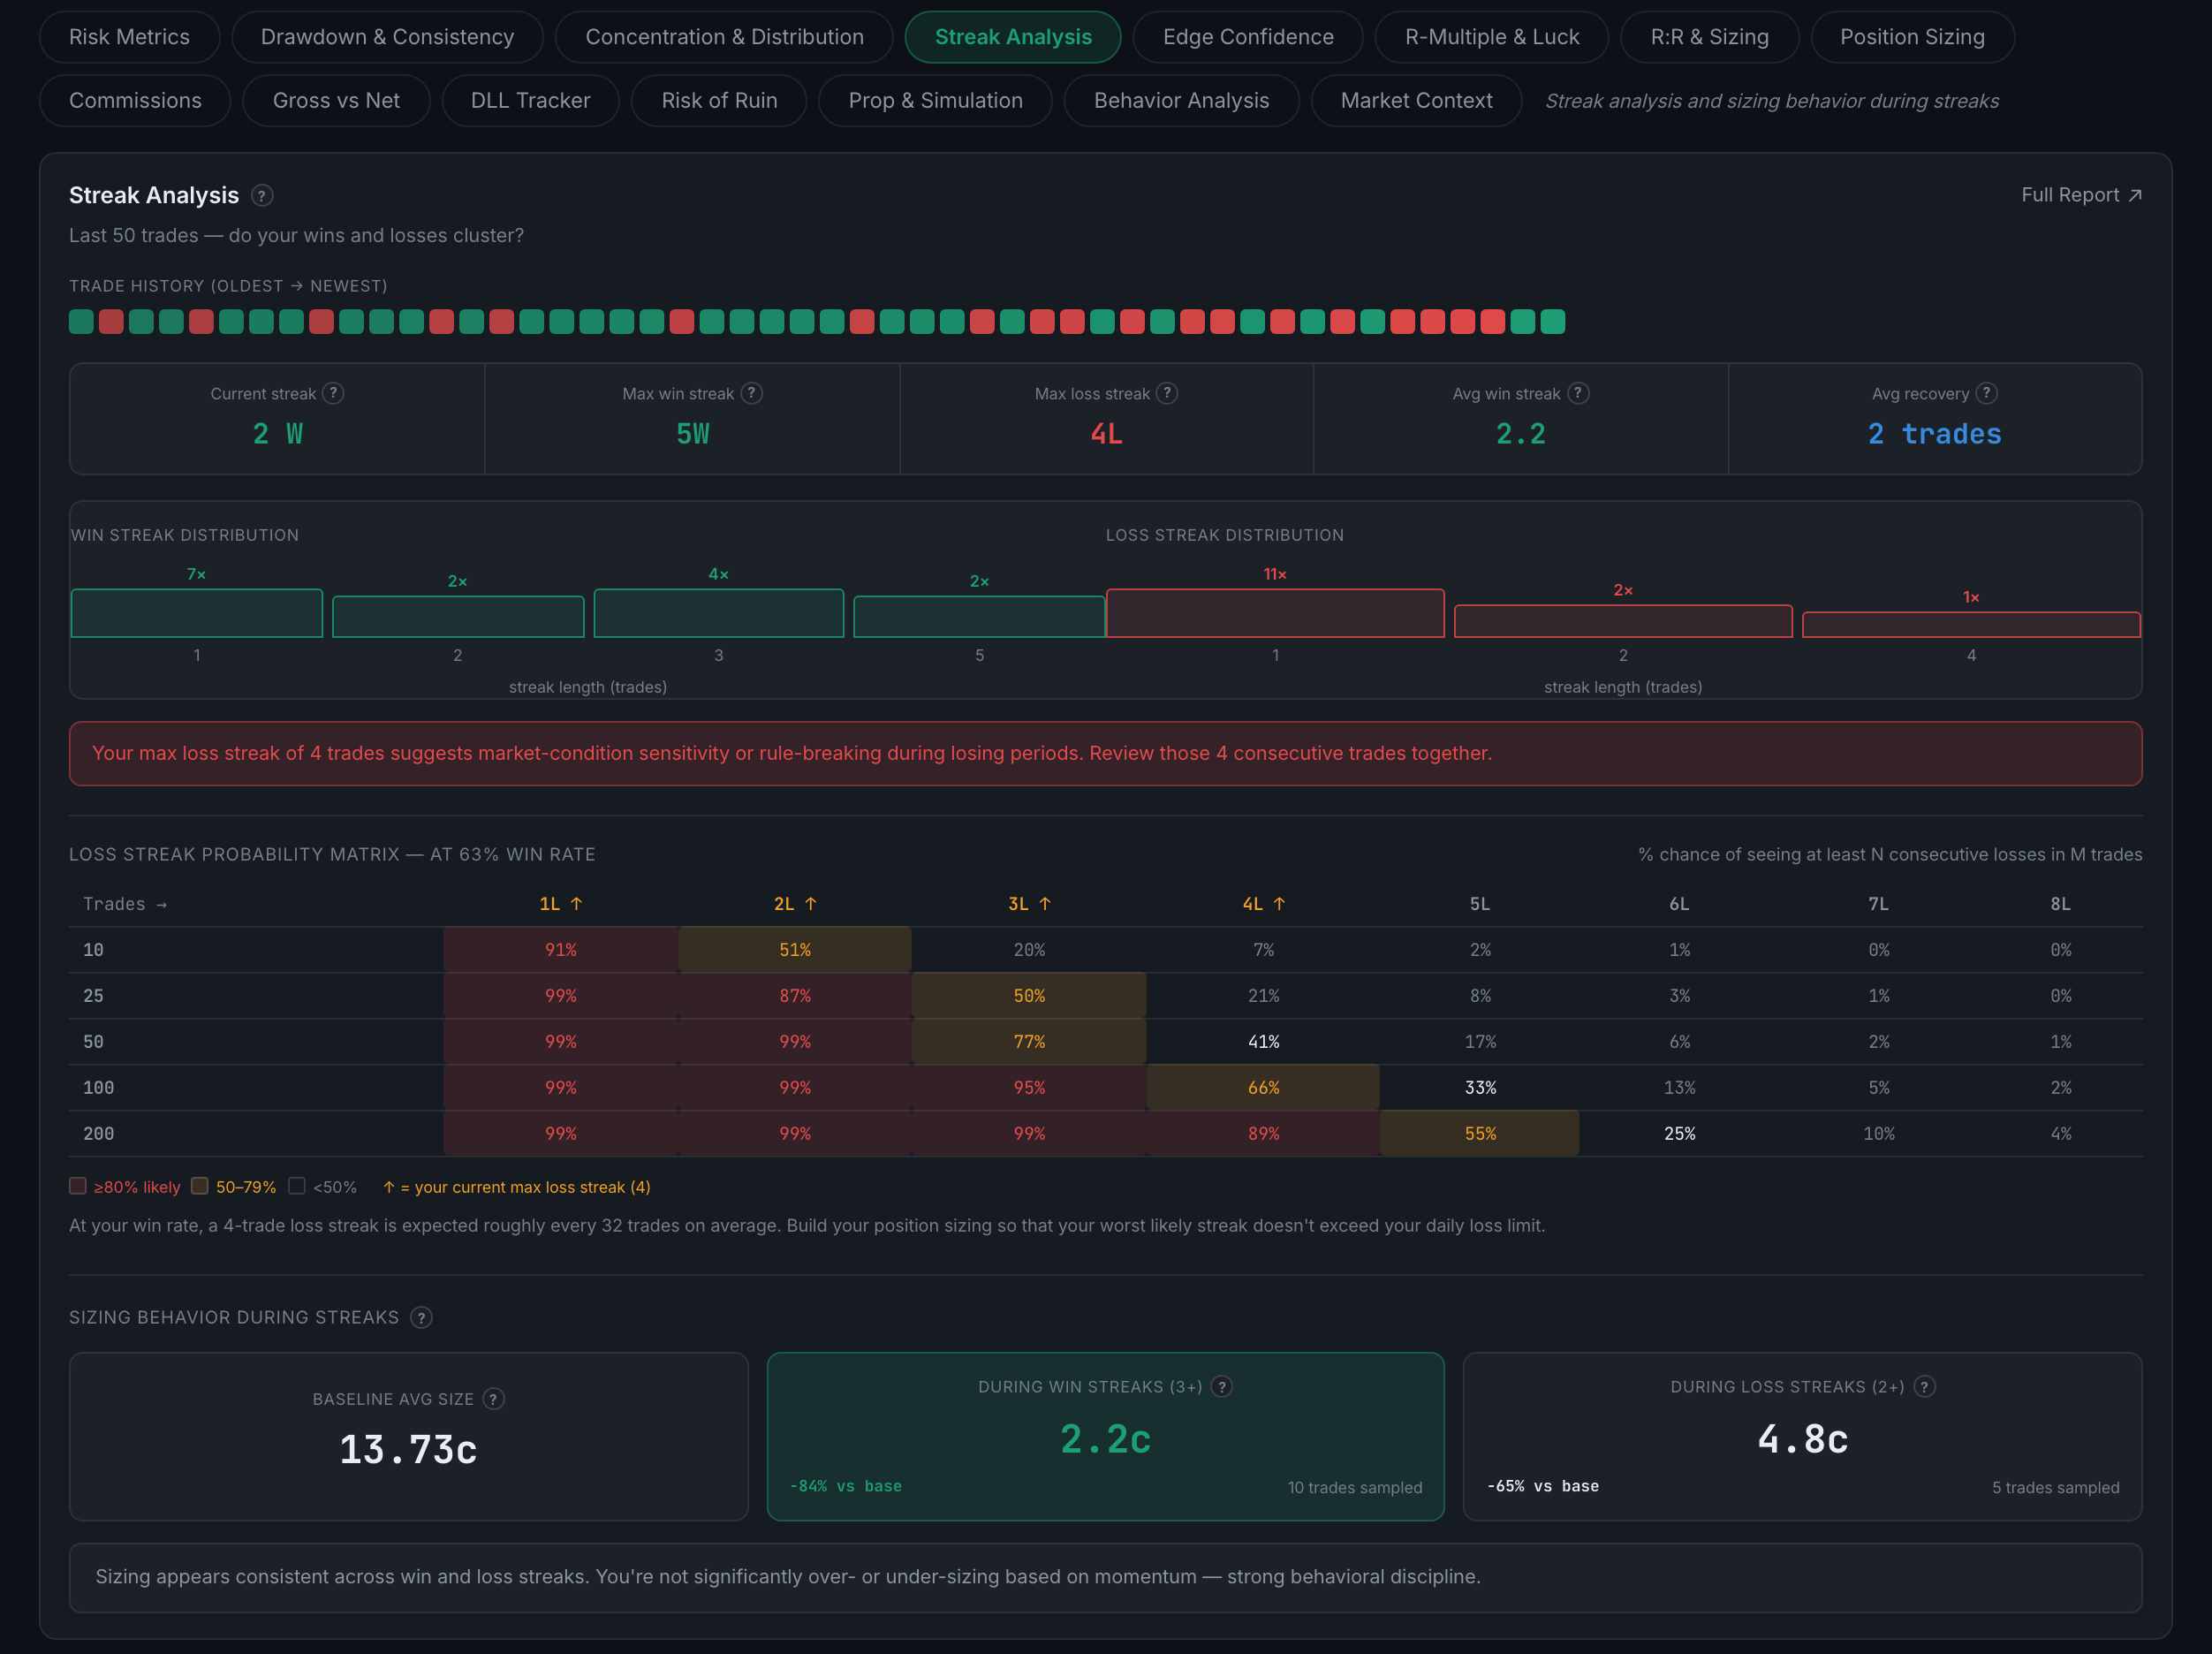
What is on the Streak Analysis sub-page?
Your win and loss runs, how likely each was, and — the useful part — whether your position size changes during them.
Streaks are mostly a story people tell themselves about randomness. The app treats them two ways: it tells you how probable your runs actually were, which usually deflates them, and then it checks whether you behaved differently during them, which usually does not deflate at all.
Indicators on this sub-page:
- Current streak, max win streak, max loss streak, average win streak, average recoveryThe raw run figures.
- Win and loss streak distributionsHow often runs of each length happen for you.
- Loss streak probability matrixThe chance of hitting at least N consecutive losses within 10, 25, 50, 100 and 200 trades, at your own win rate, with your current worst streak marked in the grid and the cells shaded by likelihood — ≥80% likely, 50–79%, under 50%. A four-loss run that felt like a collapse usually turns out to be something the table expects every thirty-odd trades.
- Sizing behaviour during streaksYour baseline average size against your average size during win streaks and during loss streaks, each with the number of trades sampled beside it. Sizing up into a win streak and down after losses is the single most common way a positive edge turns into a negative account, and this is the panel that catches it.