What is on the Edge Confidence sub-page?
How much of your record is skill rather than sample size — a confidence interval on your win rate, an R-normalized dashboard, and a Monte Carlo projection forward.
The most statistically honest sub-page in the app. Everything else reports what happened; this one puts error bars around it and says how much of it you are entitled to believe.
Indicators on this sub-page:
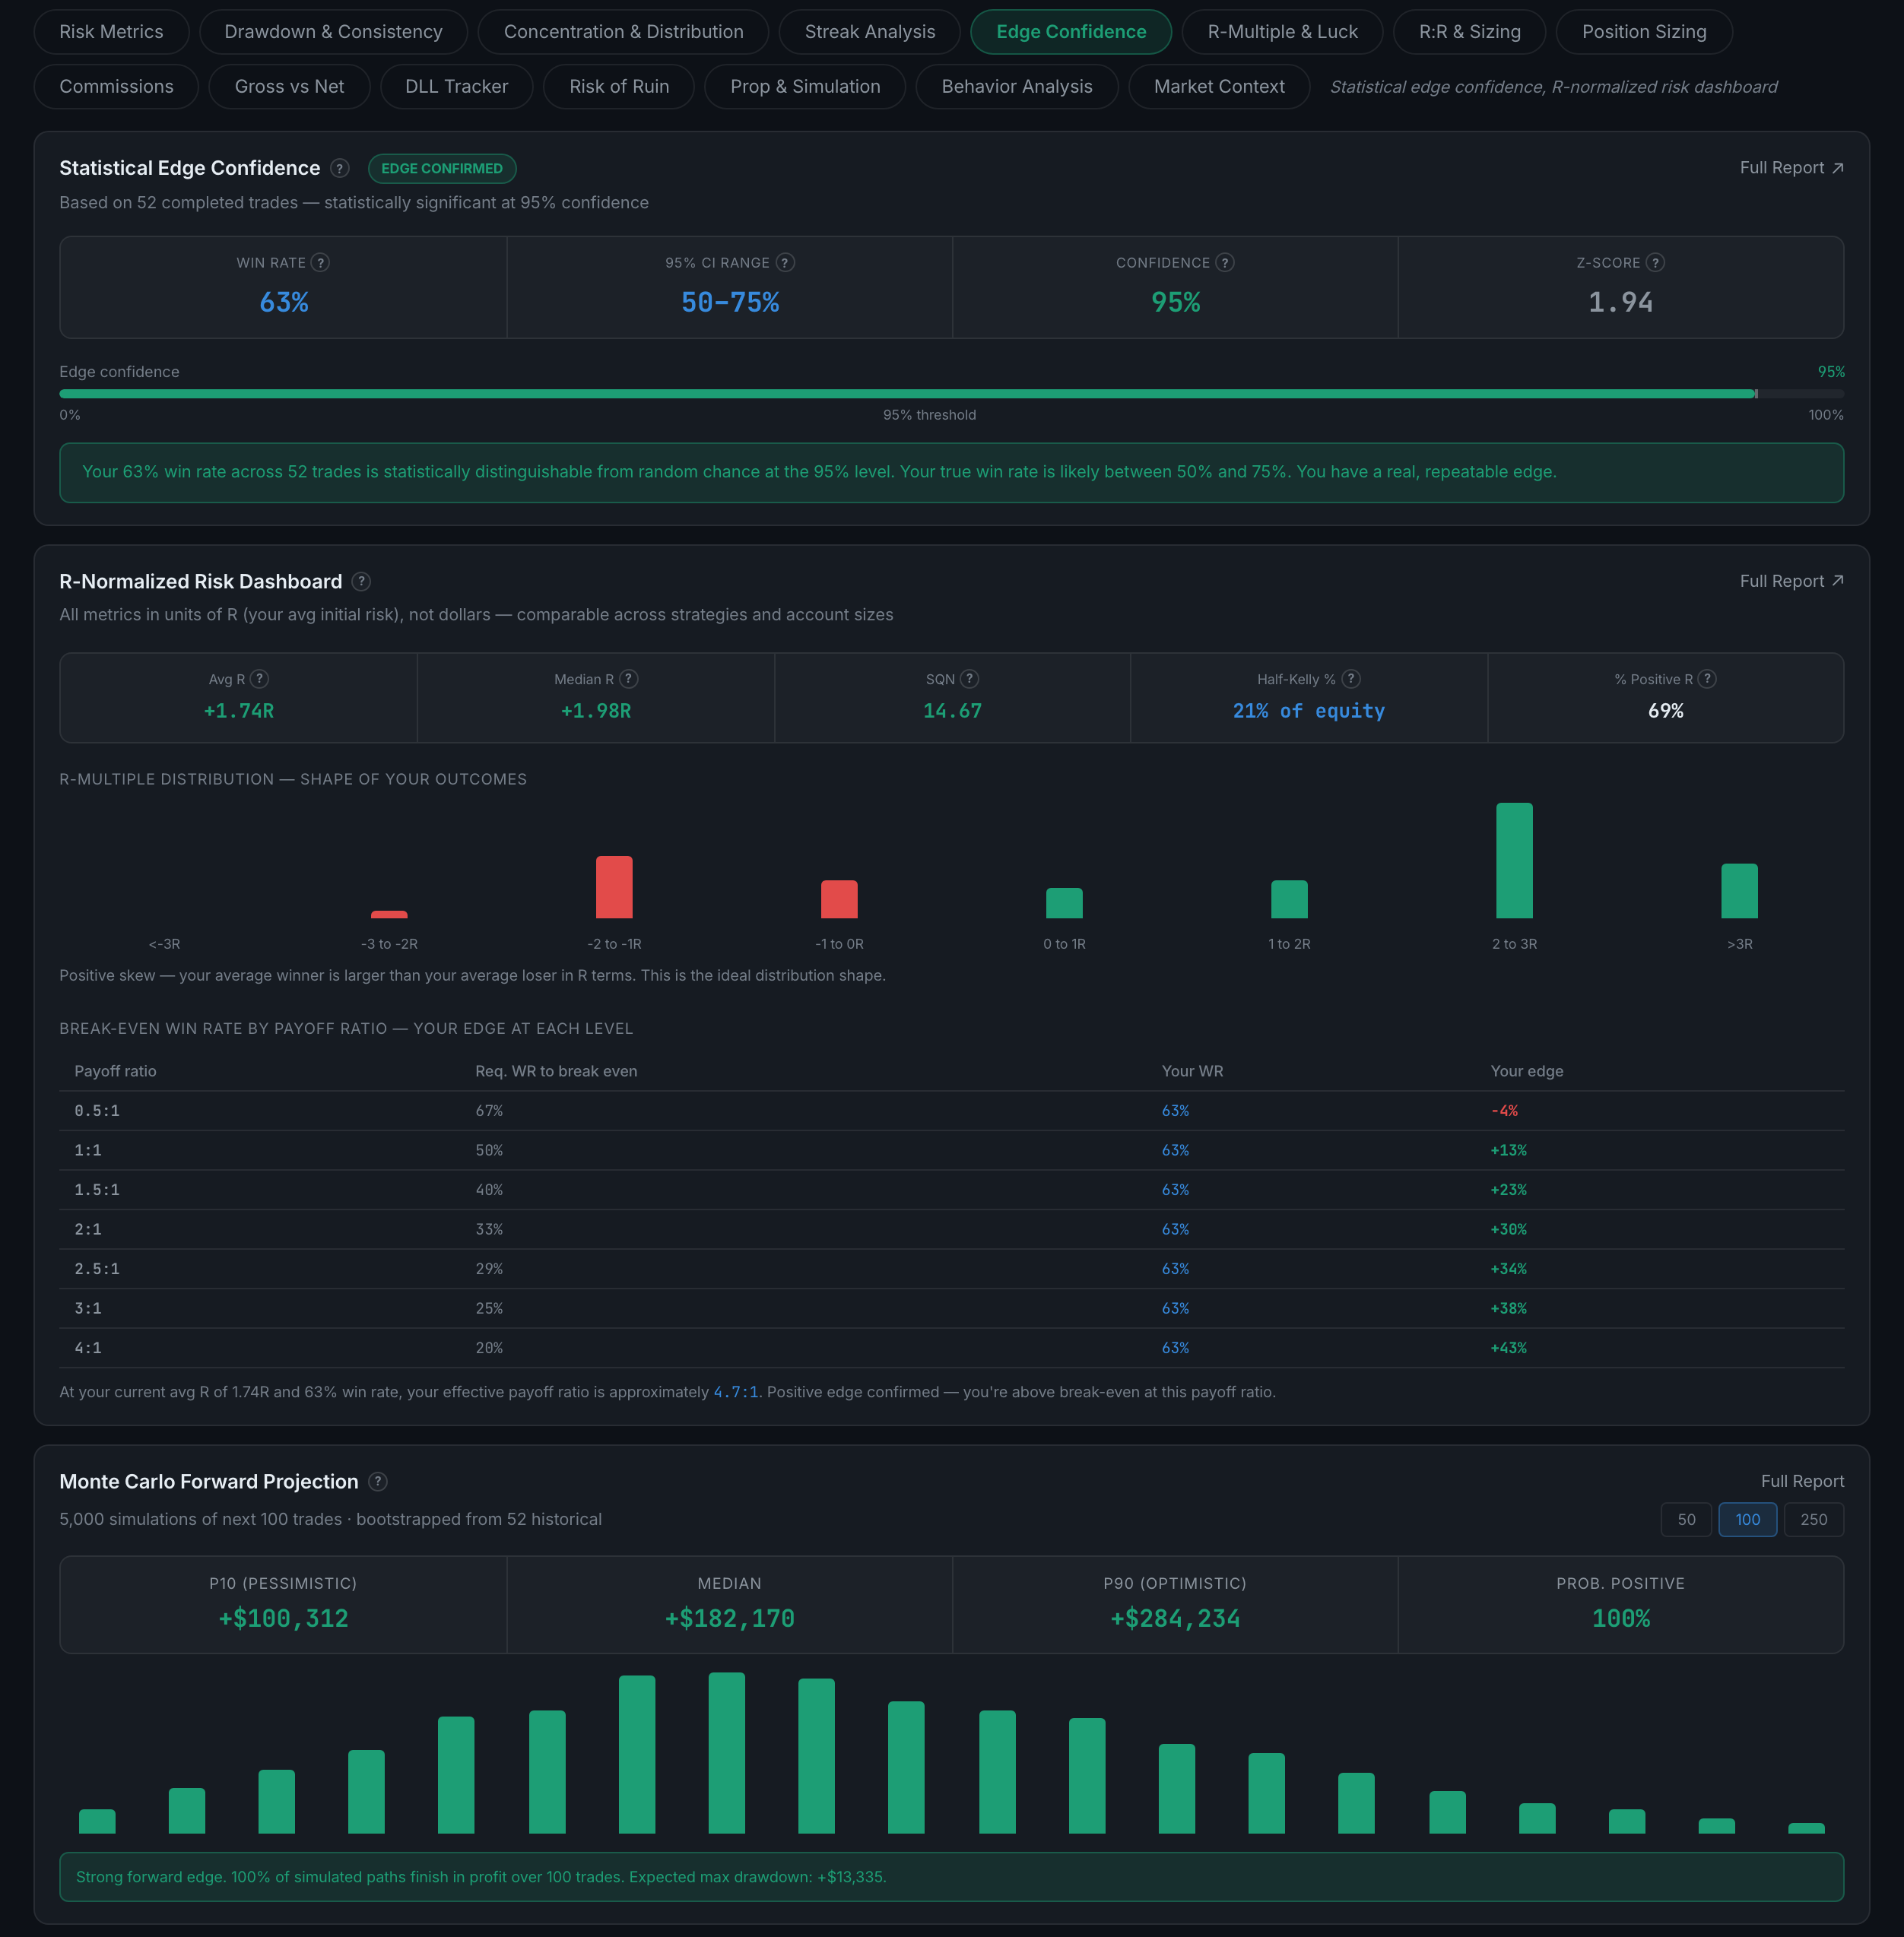
- Statistical Edge ConfidenceA badge saying whether your edge is confirmed, your win rate, the 95% confidence interval around it, the confidence level and the Z-score, then a bar showing where you sit against the 95% threshold and a sentence stating the finding in words. A 63% win rate over 52 trades reported as "likely between 50% and 75%" is both a confirmation and a warning about how wide the range still is.
- R-Normalized Risk DashboardEverything in units of R rather than dollars, so it is comparable across strategies and account sizes: average R, median R, SQN, half-Kelly as a share of equity, and the share of trades that finished positive in R. Under those, your R-multiple distribution by band with the skew read out for you. Then the best table on the sub-page: break-even win rate by payoff ratio — at 0.5:1, 1:1, 1.5:1, 2:1, 2.5:1, 3:1 and 4:1, the win rate you would need, the win rate you have, and the edge between them. It closes with your effective payoff ratio.
- Monte Carlo Forward Projection5,000 simulations of your next 50, 100 or 250 trades, bootstrapped from your actual record. Reports a pessimistic P10, a median, an optimistic P90 and the probability of finishing positive, with the distribution drawn underneath and the expected max drawdown stated in the verdict.
Needs 30 or more trades before it will compute intervals, which is exactly the right behaviour and also the reason it is empty for most new accounts.