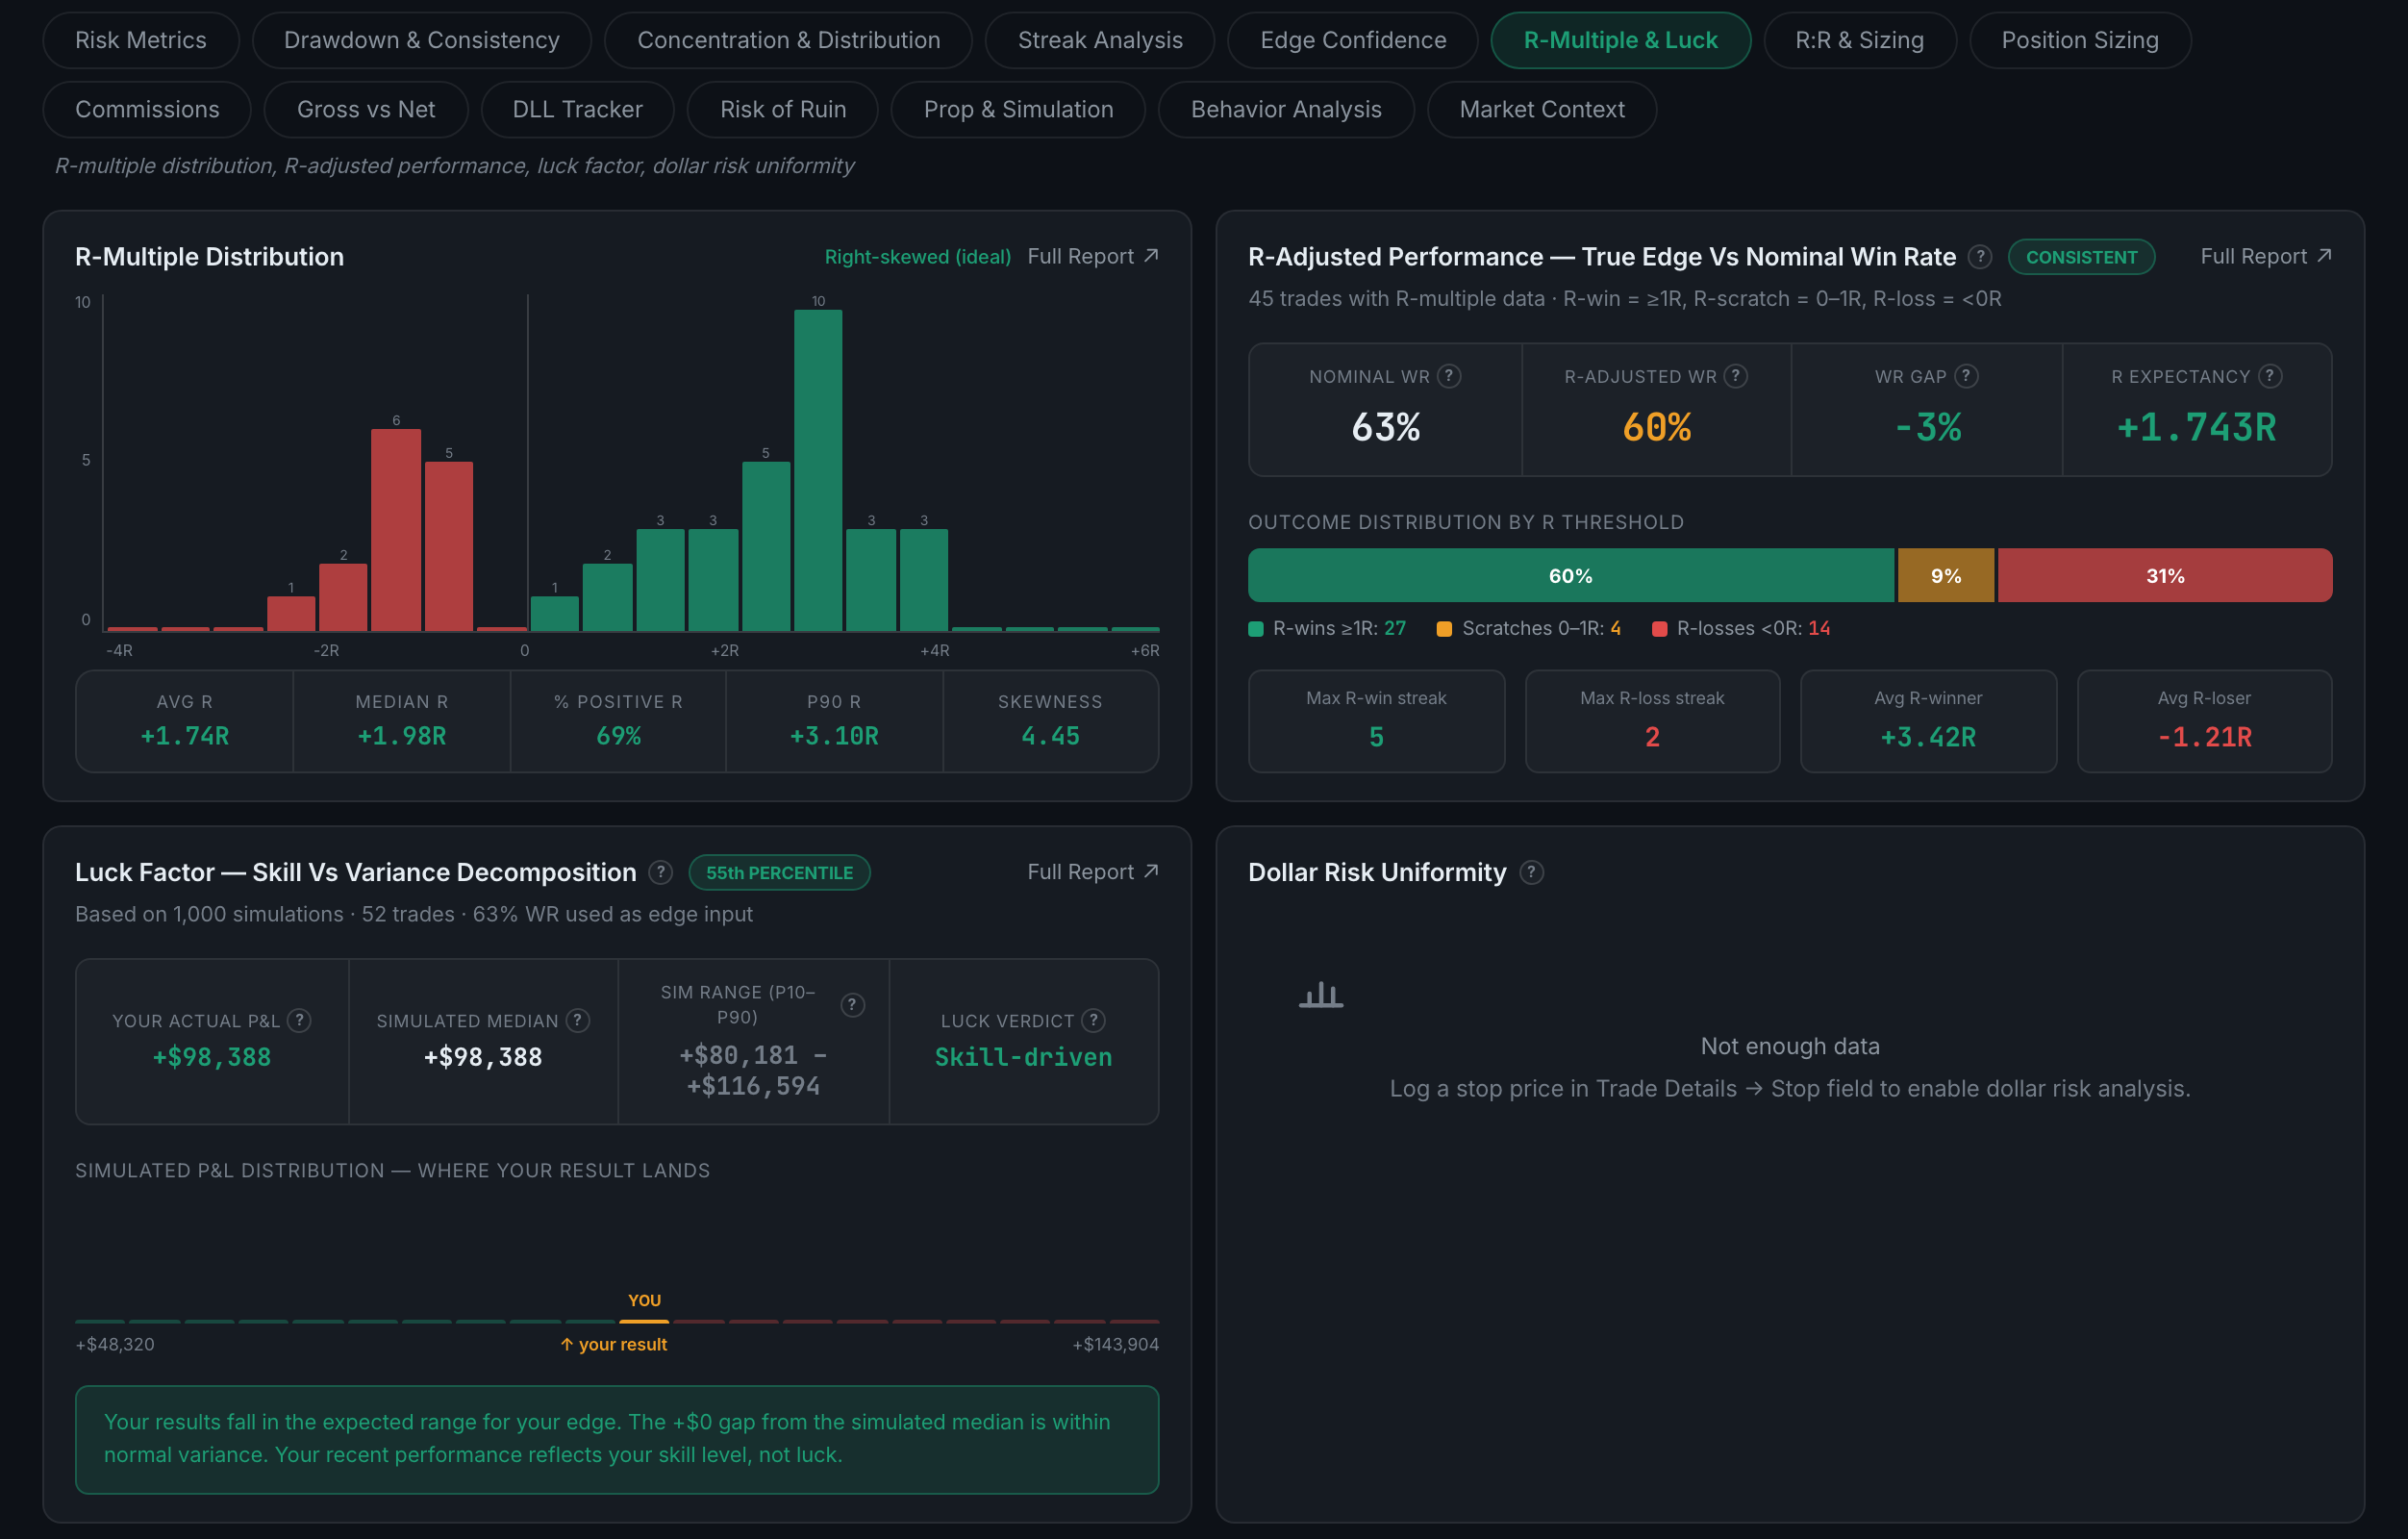
What is on the R-Multiple & Luck sub-page?
Your results measured in units of risk instead of money, and an explicit attempt to split what you earned into skill and luck.
Dollars conflate two things — how good the trade was, and how big you went. R separates them. Every panel here re-reads your record in R, and the last one goes further and puts a number on variance.
Indicators on this sub-page:
- R-Multiple DistributionA histogram of your trades in R, labelled with its shape, and five figures under it: average R, median R, the share of positive-R trades, your P90 and skewness. Right-skewed is the shape you want and the panel says so.
- R-Adjusted Performance — True Edge vs Nominal Win RateYour headline win rate against a win rate that counts only trades clearing 1R, with the gap between them and your R expectancy. Under those, your outcomes split into R-wins at 1R or more, scratches between 0 and 1R and R-losses below zero, plus your longest R-win and R-loss streaks and your average R-winner and R-loser. A large gap means a chunk of your win rate is scratches, which pay nothing.
- Luck Factor — Skill vs Variance Decomposition1,000 simulations of a trader with your edge, giving a median and a P10–P90 range, then where your actual result lands in that distribution as a percentile, with a verdict of skill-driven or luck-driven. Landing above the range is not a compliment; it means the next stretch will likely look worse.
- Dollar Risk UniformityWhether you risk a consistent amount per trade. Needs a stop price logged in Trade Details → Stop, and says so when it does not have one.