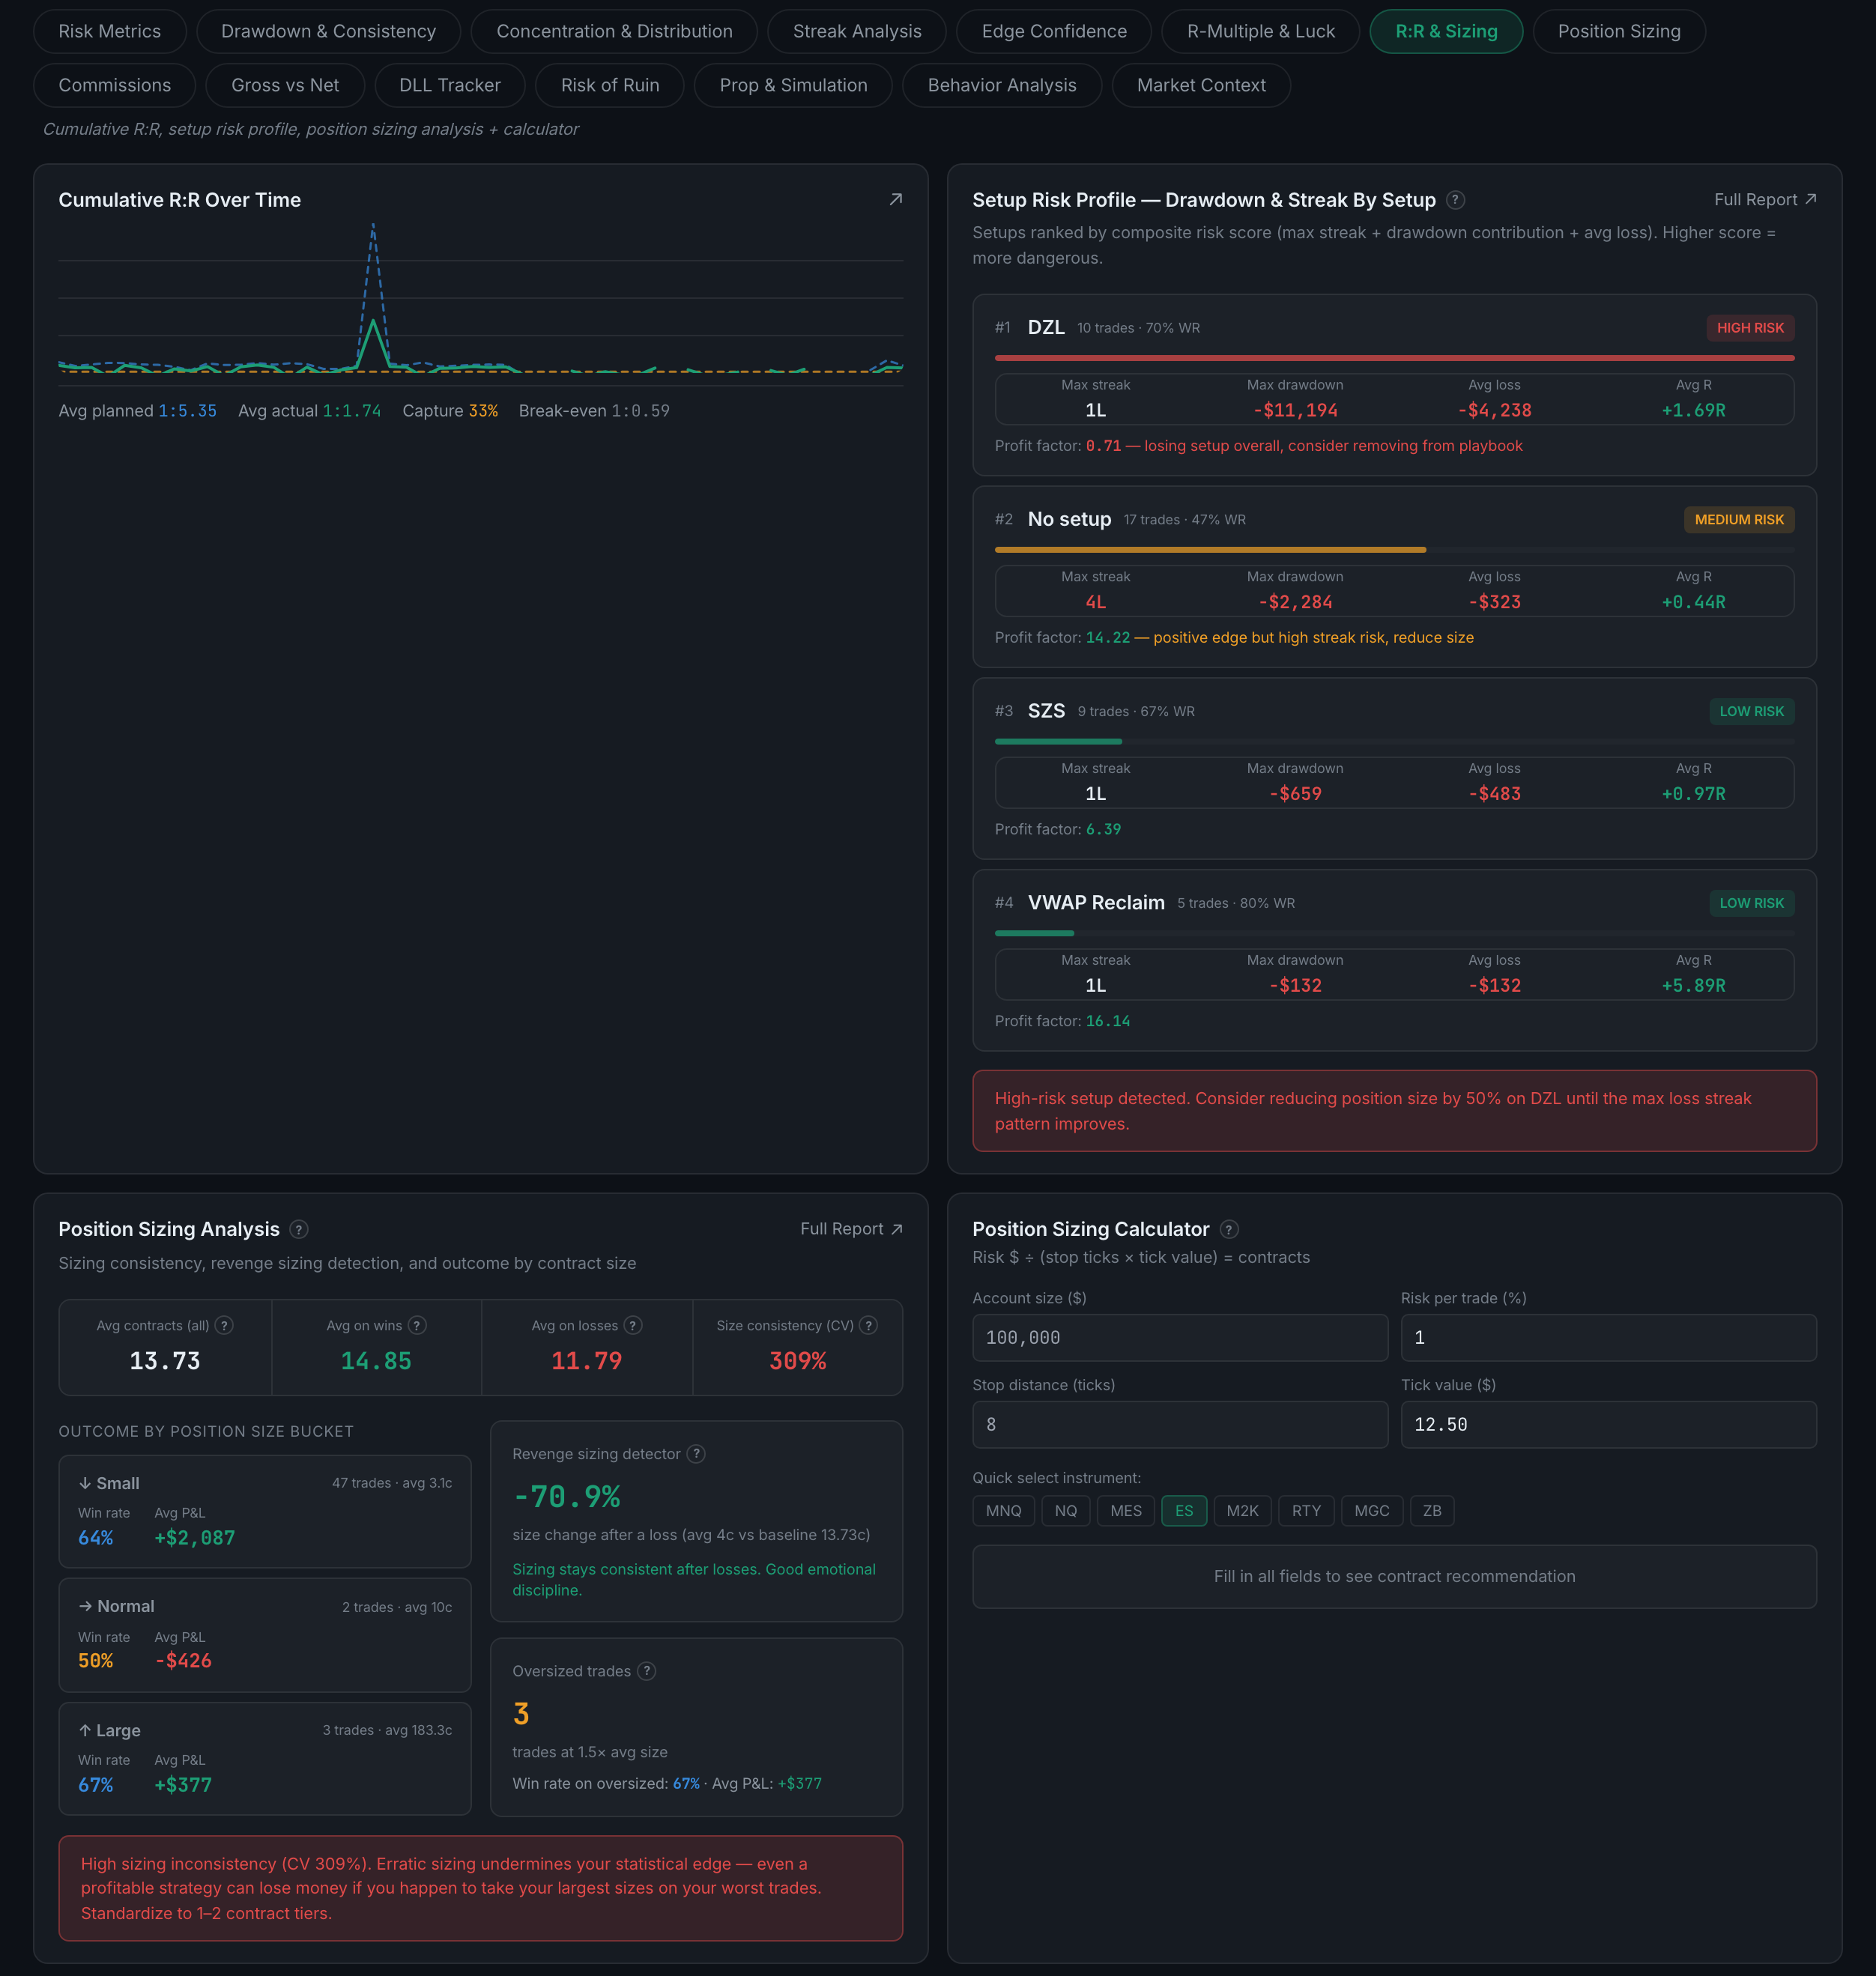
What is on the R:R & Sizing sub-page?
Cumulative reward-to-risk over time, a risk profile per setup, your sizing analysis, and a position size calculator you can actually use.
The bridge between measurement and action. The first three panels tell you what your sizing has been; the last one lets you work out what it should be for the next trade.
Indicators on this sub-page:
- Cumulative R:R Over TimeYour planned R:R and your actual R:R plotted together, with four figures underneath: average planned, average actual, the percentage of the plan you captured, and the break-even ratio. The gap between planned and actual is the whole reading.
- Setup Risk Profile — Drawdown & Streak by SetupSetups ranked by a composite risk score, each badged high, medium or low risk, with its worst loss streak, worst drawdown, average loss, average R and profit factor, plus a written judgement per setup. It closes by naming the setup to size down on. This is where a setup with a decent average and a brutal worst case gets caught — and note that a setup can be high risk and profitable.
- Position Sizing AnalysisAverage contracts overall, on wins and on losses, and size consistency as a coefficient of variation. Then outcome by size bucket (small, normal, large) with win rate and average P&L each, a revenge sizing detector measuring how much your size changes after a loss, and a count of oversized trades at 1.5× your average with how they did. It ends with a verdict on your sizing consistency.
- Position Sizing CalculatorFour fields: account size, risk per trade as a percentage, stop distance in ticks, and tick value. A row of quick-select instrument buttons — MNQ, NQ, MES, ES, M2K, RTY, MGC, ZB — fills the tick value for you. It returns a contract count, and it rounds down rather than up. It calculates only; it does not place, size or record anything.