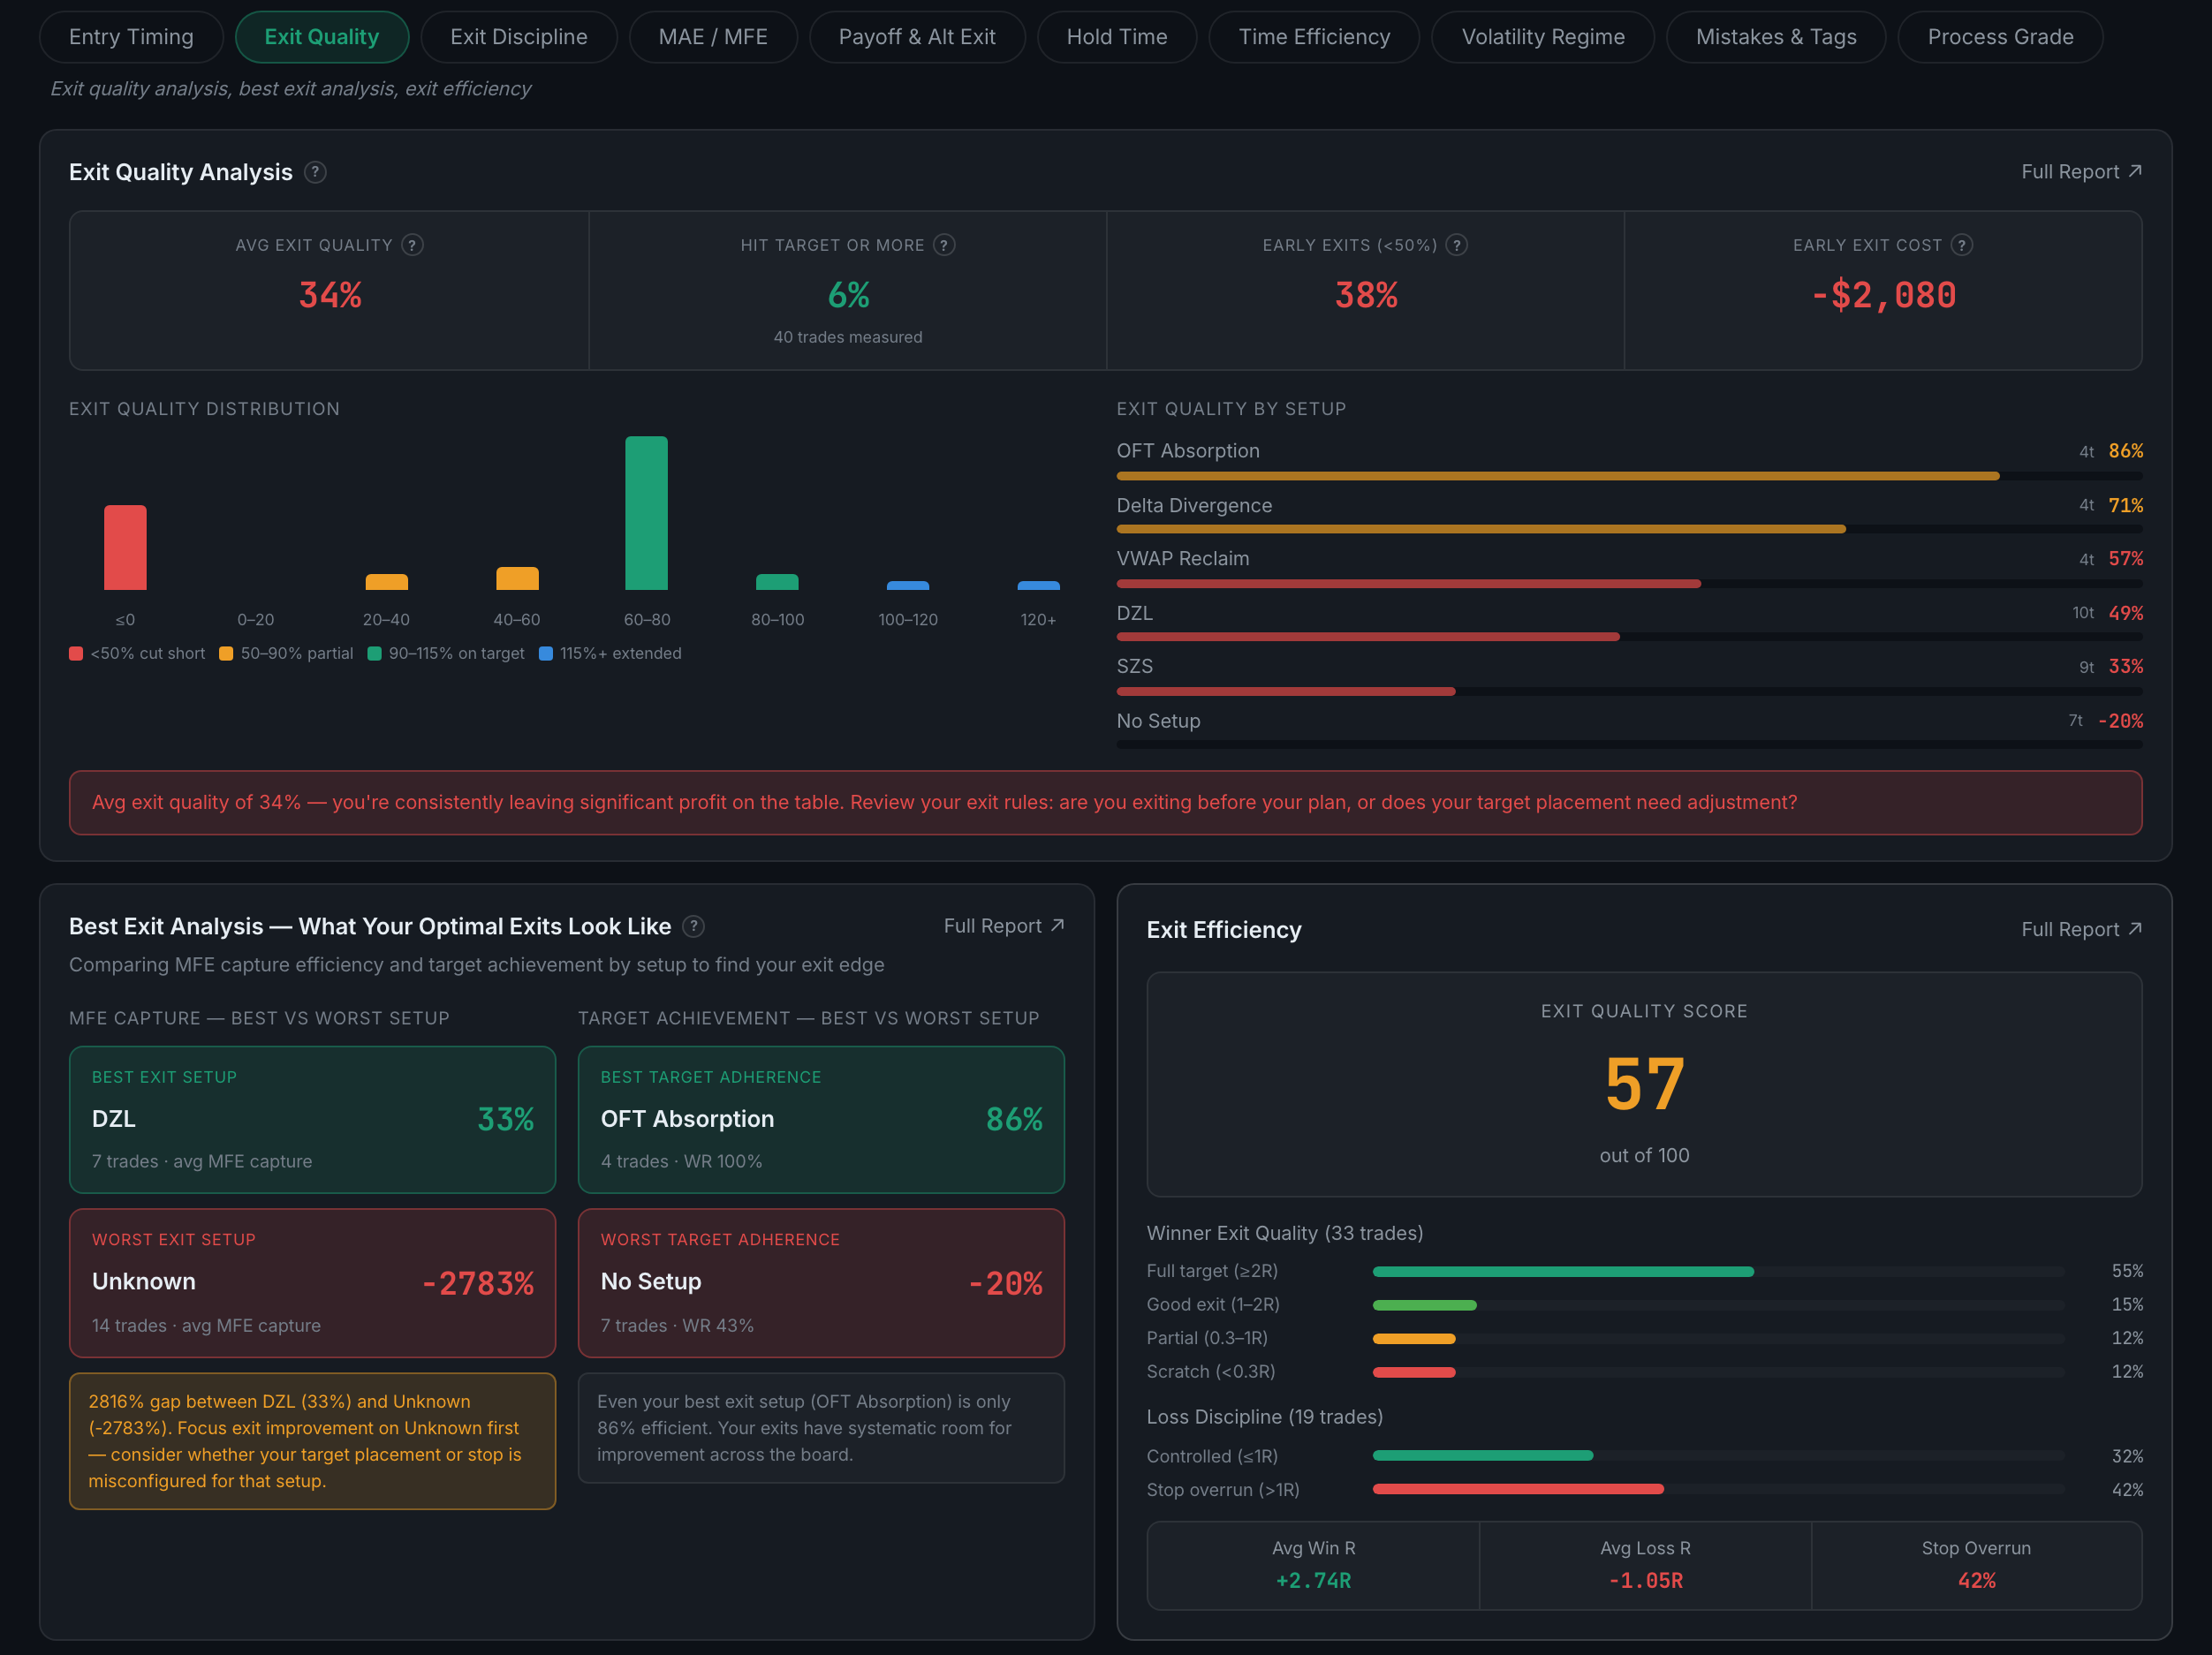
What is on the Exit Quality sub-page?
How much of each move you actually captured — exit quality, what your best exits looked like, and exit efficiency by setup.
For most traders this is the largest leak in the account, and it is invisible in P&L. A winning trade closed at a third of its move is filed as a win, and only this sub-page will tell you it was two-thirds of a loss.
Indicators on this sub-page:
- Exit Quality AnalysisAverage exit quality, the share of trades that hit target or more, the share that were early exits under 50%, and what those early exits cost in money. Under those, a distribution of every exit across four bands — cut short under 50%, partial at 50–90%, on target at 90–115%, extended beyond 115% — and the same quality per setup, ending in a verdict.
- Best Exit Analysis — What Your Optimal Exits Look LikeTwo comparisons: your best and worst setup by MFE capture, and your best and worst by target adherence, each with its trade count. Both come with a written note, and the notes are willing to say that even your best setup has room.
- Exit EfficiencyAn exit quality score out of 100, then your winners split into full target (2R or more), good exit (1–2R), partial (0.3–1R) and scratch (under 0.3R), and your losses into controlled (1R or less) and stop overrun (more than 1R). Three figures close it: average win R, average loss R, and your stop overrun rate.
Watch for a setup showing an efficiency far outside the normal range — an untagged cohort at −2783% is a handful of trades that went the wrong way, not a finding about a setup.
Needs stop and target prices on your trades, plus at least two setups with five or more trades each, before the analysis will build.