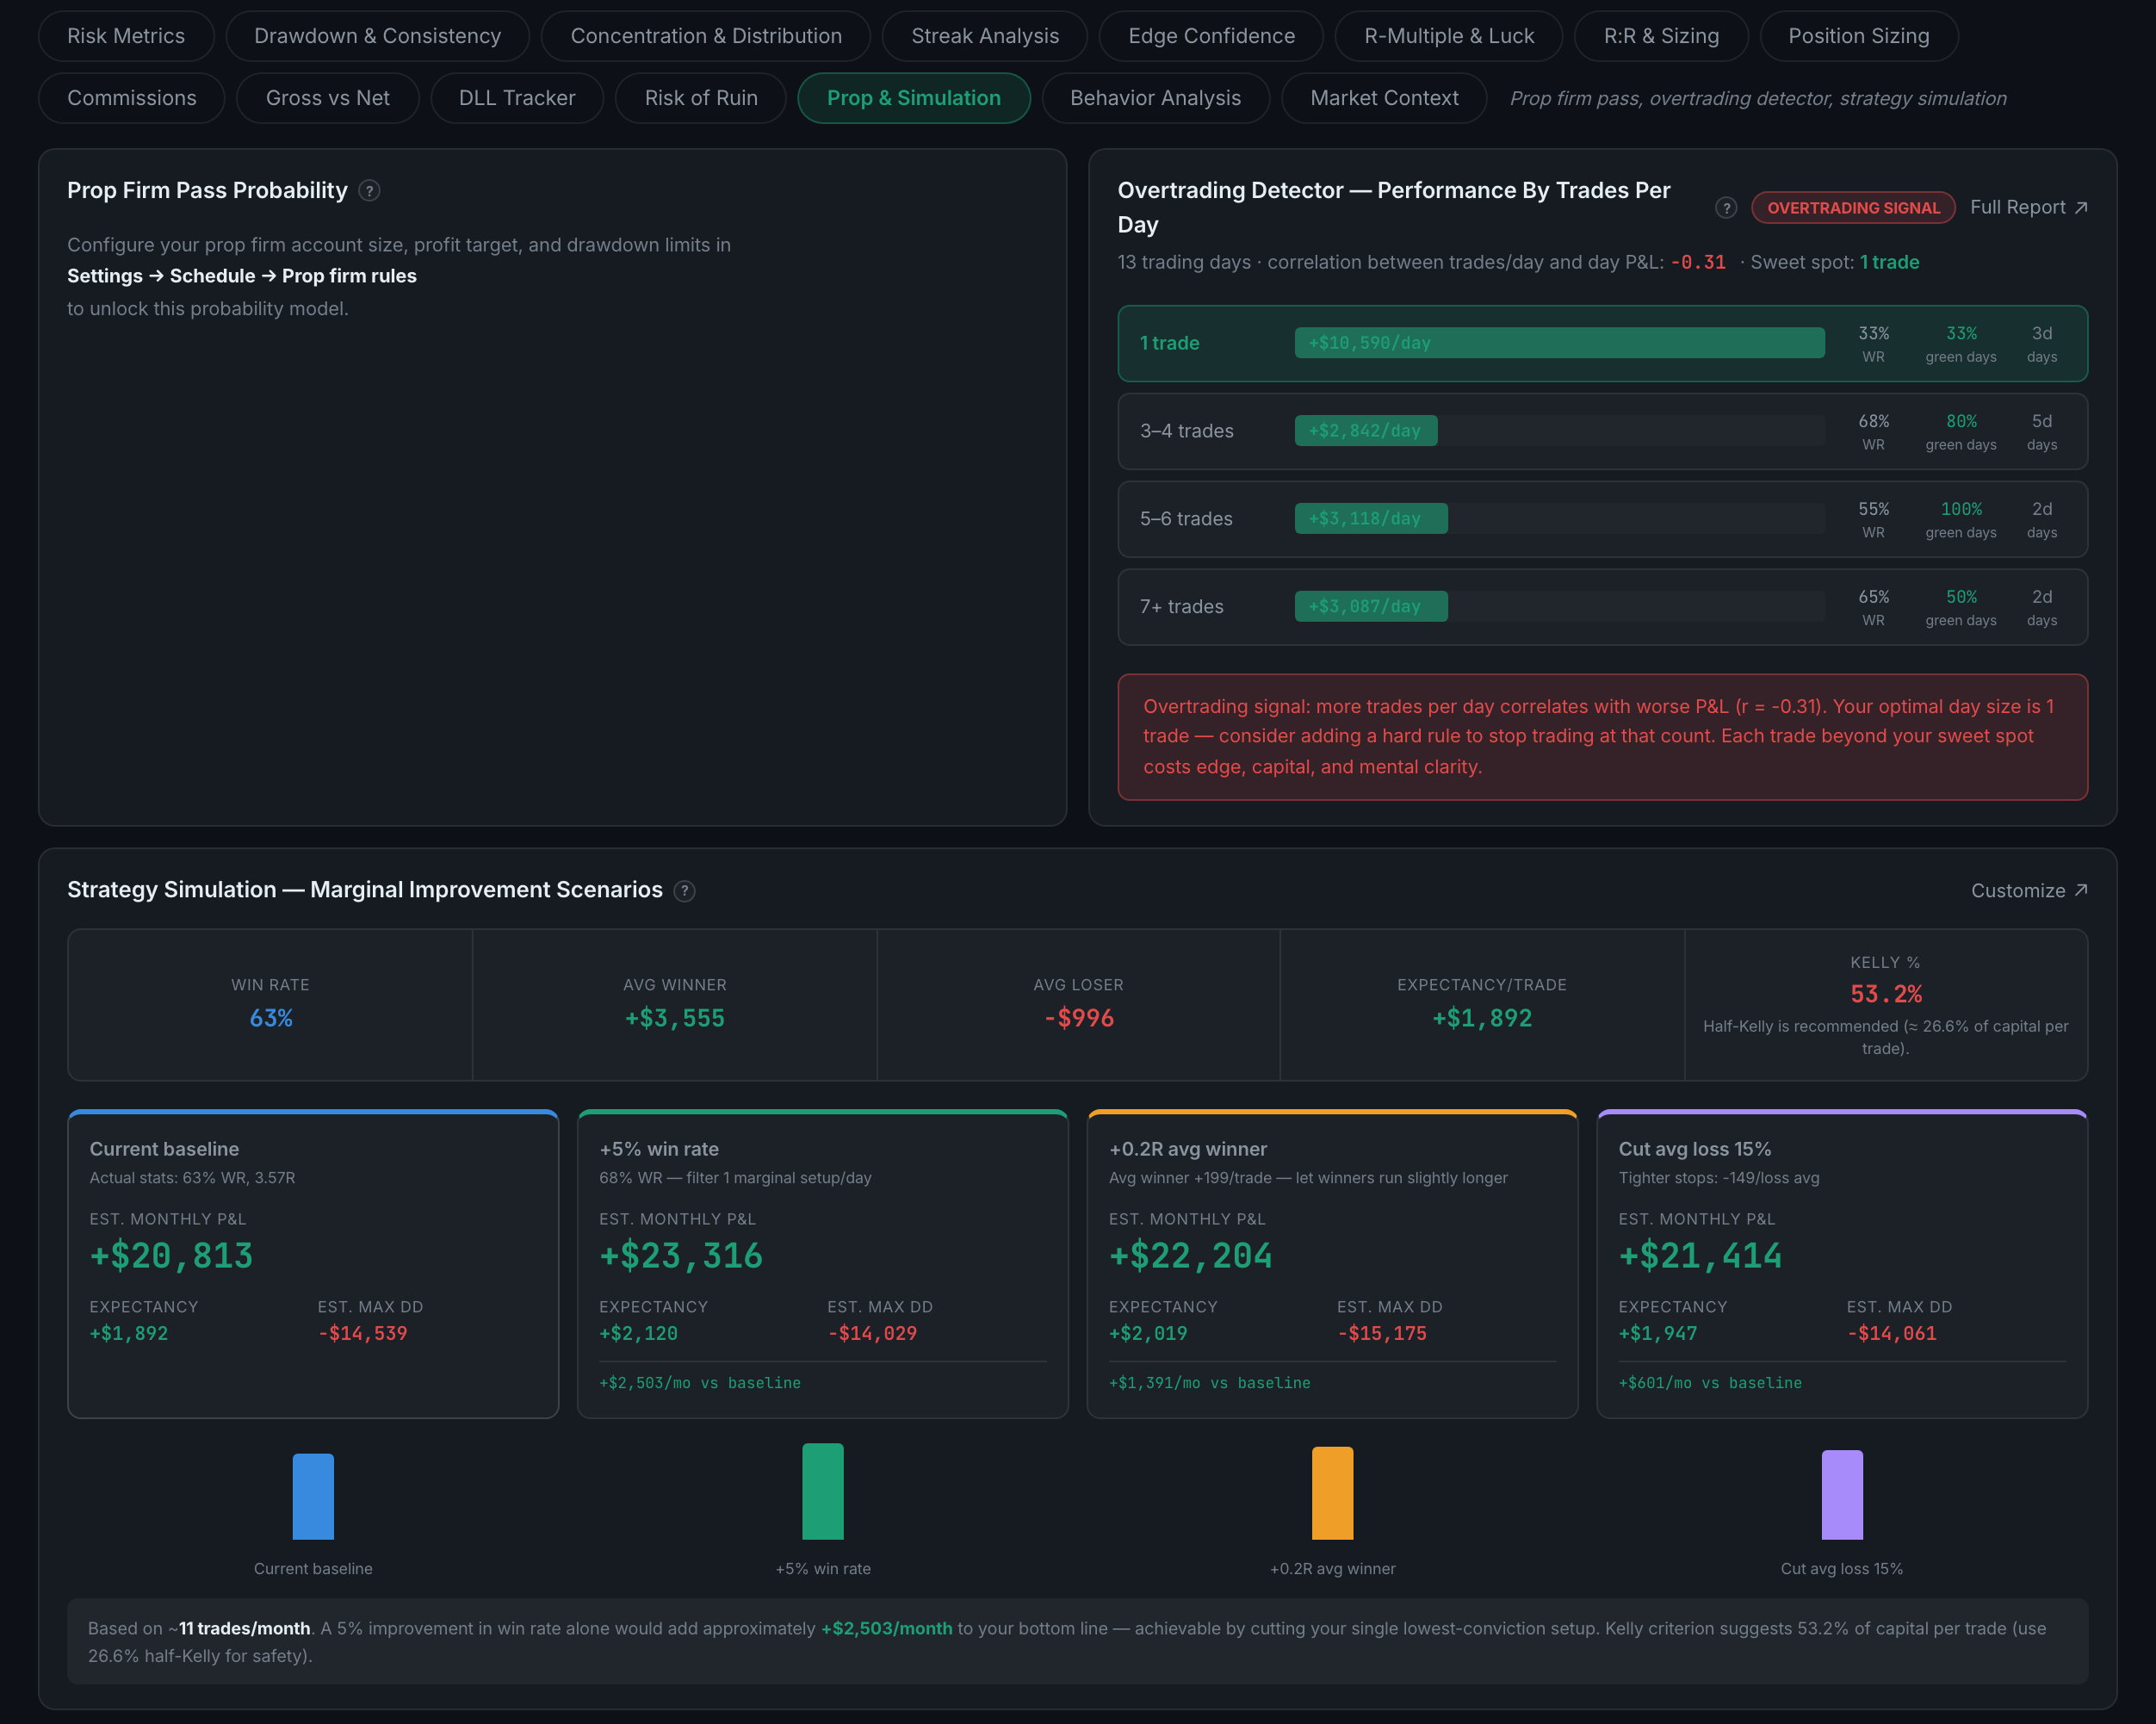
What is on the Prop & Simulation sub-page?
Your odds of passing an evaluation, an overtrading detector, and a simulation of what specific improvements would be worth.
Three forward-looking panels that share a shape: each one changes a variable and shows you the consequence, so you can choose what to work on by size of payoff rather than by which weakness annoys you most.
Indicators on this sub-page:
- Prop Firm Pass ProbabilityA rough read on whether you are on course to hit a profit target before breaching a drawdown rule. Treat it as a gauge, not a forecast: it is a scored heuristic built from your recent trajectory, your bad days, your volatility and how close you are sitting to the drawdown limit — not a simulation of thousands of paths. The Monte Carlo on this tab is Risk of Ruin, which is a different panel and a different method. This one stays empty until you configure account size, profit target and drawdown limits in Settings → Schedule → Prop firm rules, and it says exactly that rather than showing a blank chart.
- Overtrading Detector — Performance by Trades per DayYour days bucketed by trade count, each with average daily P&L, win rate, green-day percentage and how many days fell in it. Above them, the correlation between trades per day and day P&L, and your sweet spot. A negative correlation earns an Overtrading signal badge and a blunt recommendation to add a hard stop-trading rule at that count.
- Strategy Simulation — Marginal Improvement ScenariosYour current baseline against three what-ifs: 5% more win rate, 0.2R more on the average winner, and a 15% smaller average loss. Each shows estimated monthly P&L, expectancy and estimated max drawdown, and what it adds against the baseline per month. Above them sit the inputs it is built on — win rate, average winner, average loser, expectancy and Kelly. The scenarios are adjustable through Customize.
That last panel is the one to use for deciding what to work on, because it prices each improvement rather than ranking them by how annoying they are. Note it extrapolates from your current trade rate, which it states — a monthly figure built on eleven trades a month is an estimate, not a forecast.