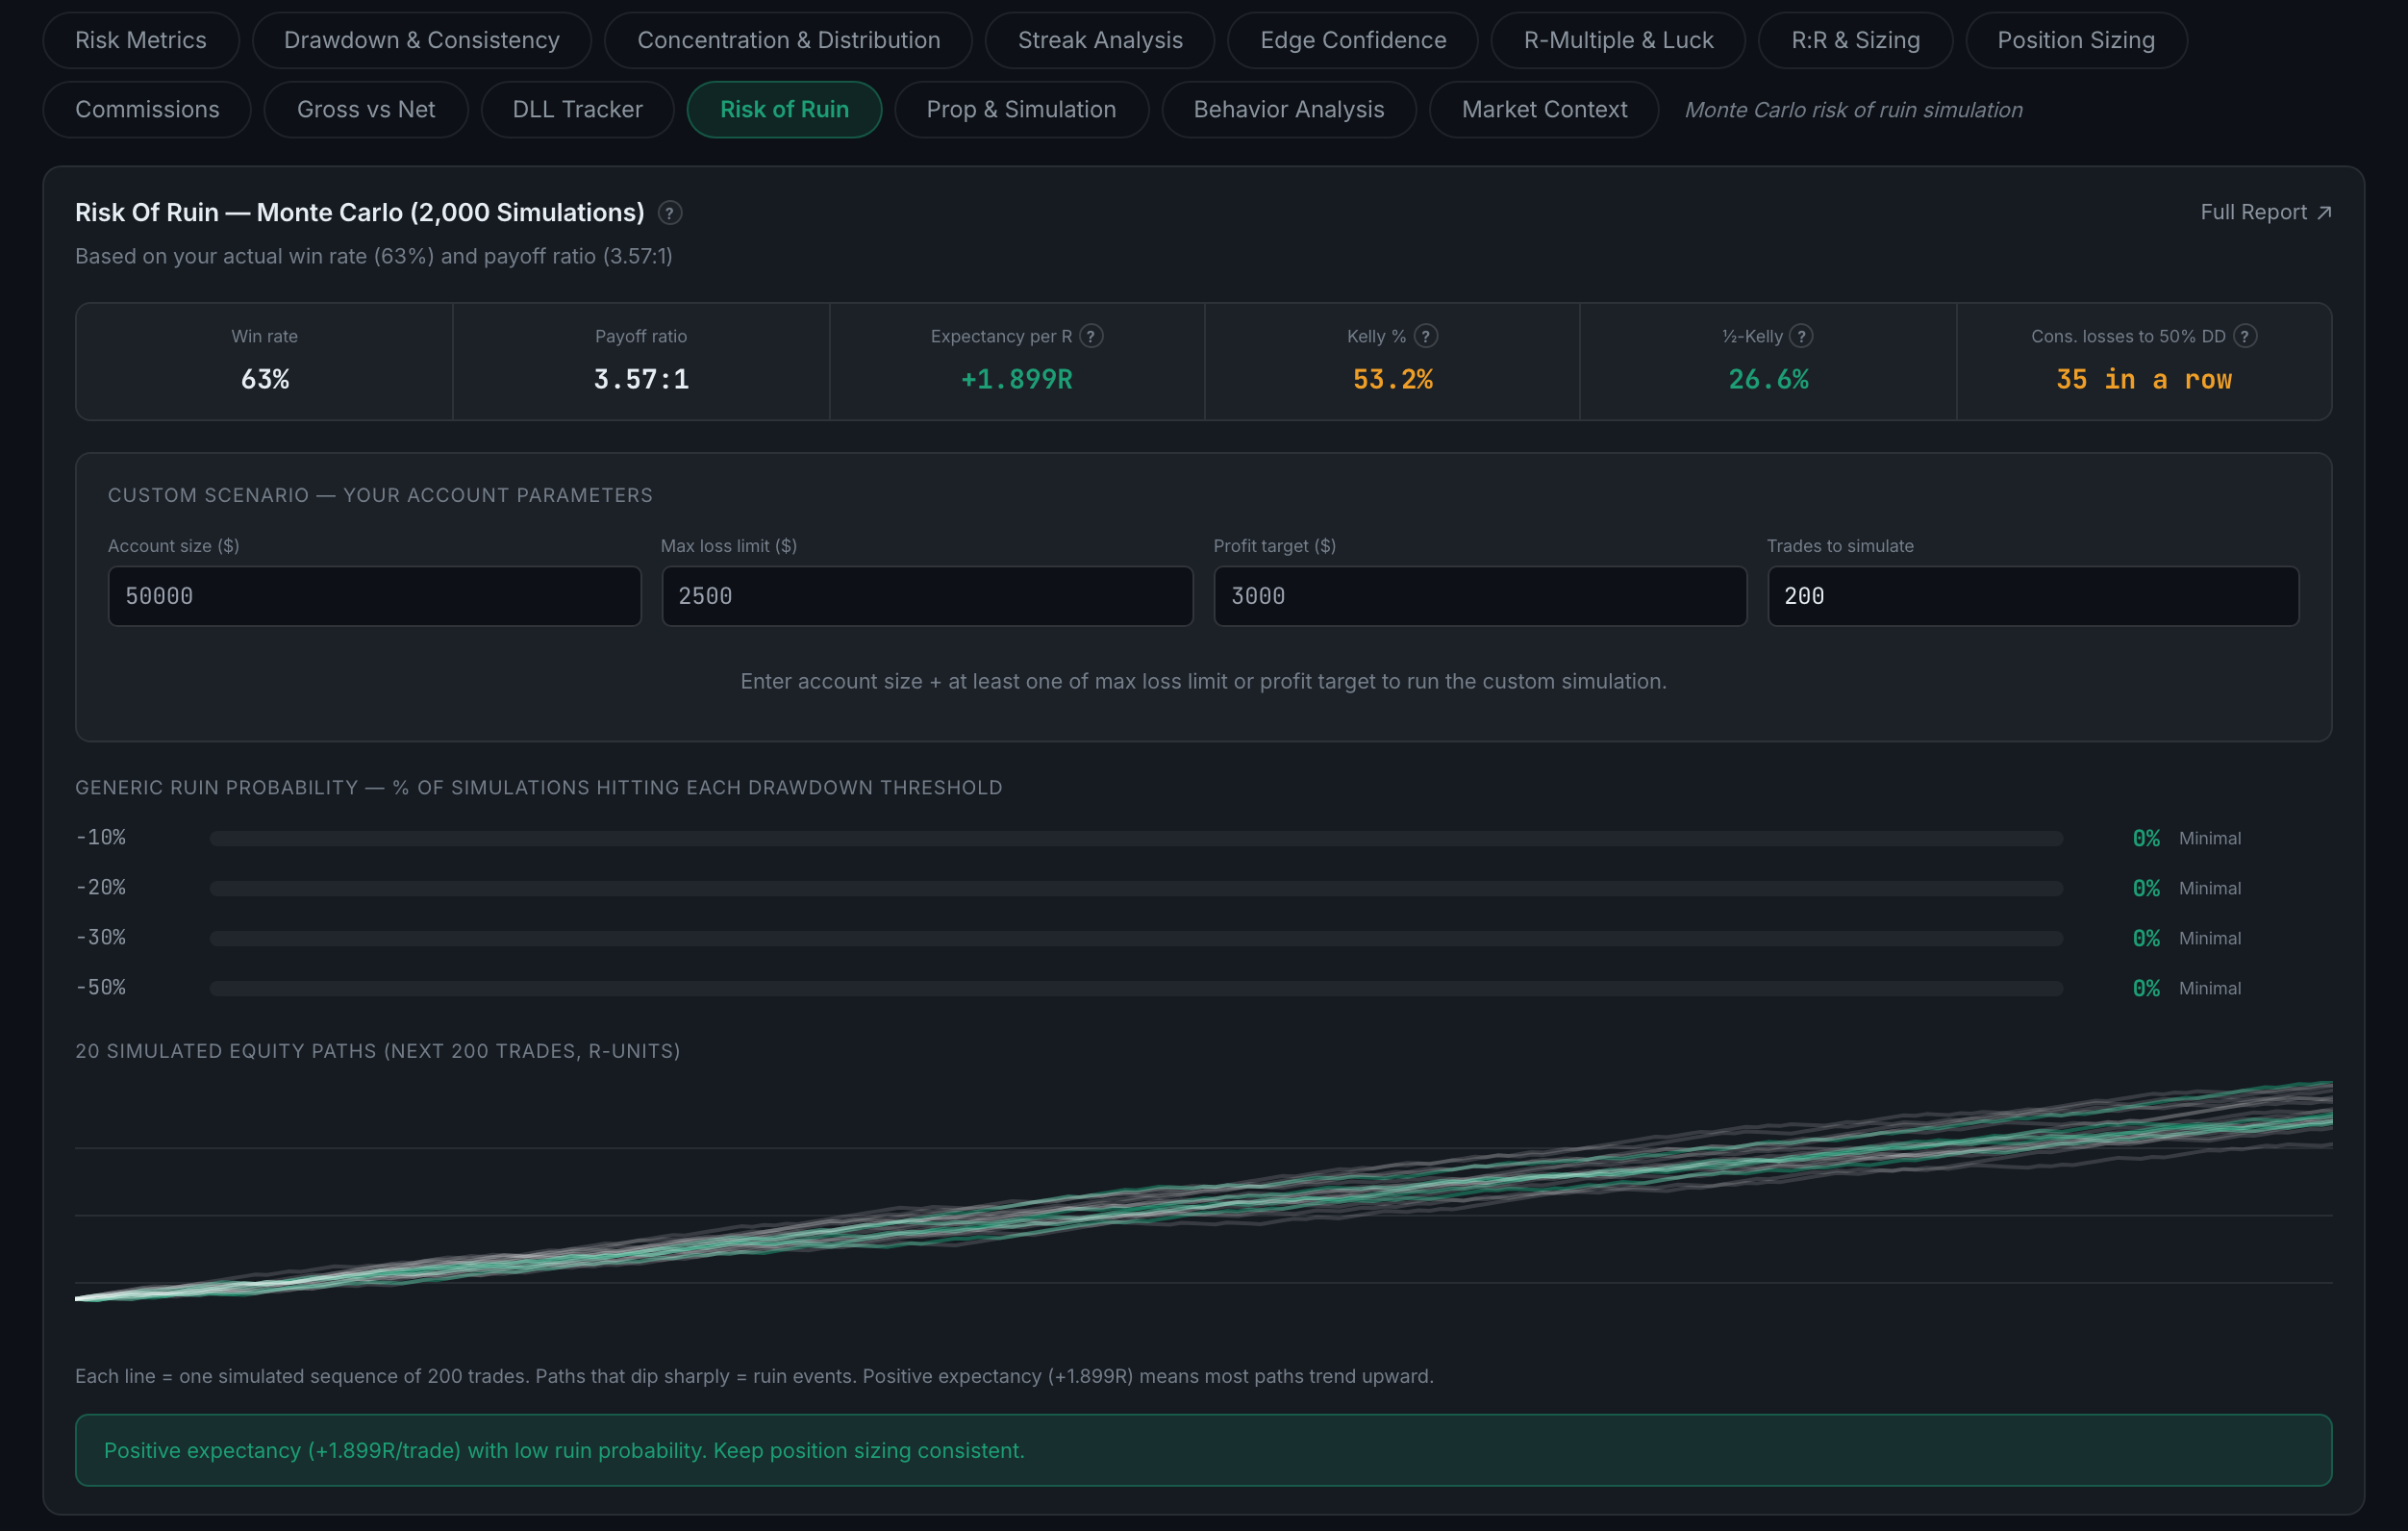
What is on the Risk of Ruin sub-page?
A Monte Carlo simulation — 2,000 runs — of how likely a sequence of losses is to end your account.
The only sub-page in Analytics that is entirely about the future. It takes your win rate, your payoff ratio and your capital, and replays the next stretch of trades thousands of times to count how often it ends badly.
Indicators on this sub-page:
- Six input figuresWin rate, payoff ratio, expectancy per R, Kelly %, ½-Kelly, and the number of consecutive losses it would take to put you in a 50% drawdown. That last one is the figure most worth carrying around.
- Custom scenarioFour fields: account size, max loss limit, profit target and how many trades to simulate. Account size plus at least one of the loss limit or profit target is enough to run it.
- Generic ruin probabilityThe share of simulations that touch a 10%, 20%, 30% and 50% drawdown, each with a plain-language band beside it from minimal upward.
- Twenty simulated equity paths over the next 200 trades, in R. Lines that dip sharply are the ruin events; with positive expectancy most of them trend up, and the spread between the best and worst line is the honest picture of variance.
- A verdict line summarising expectancy and ruin probability together.
Needs 20 or more trades.