What is on the Readiness & Correlation sub-page?
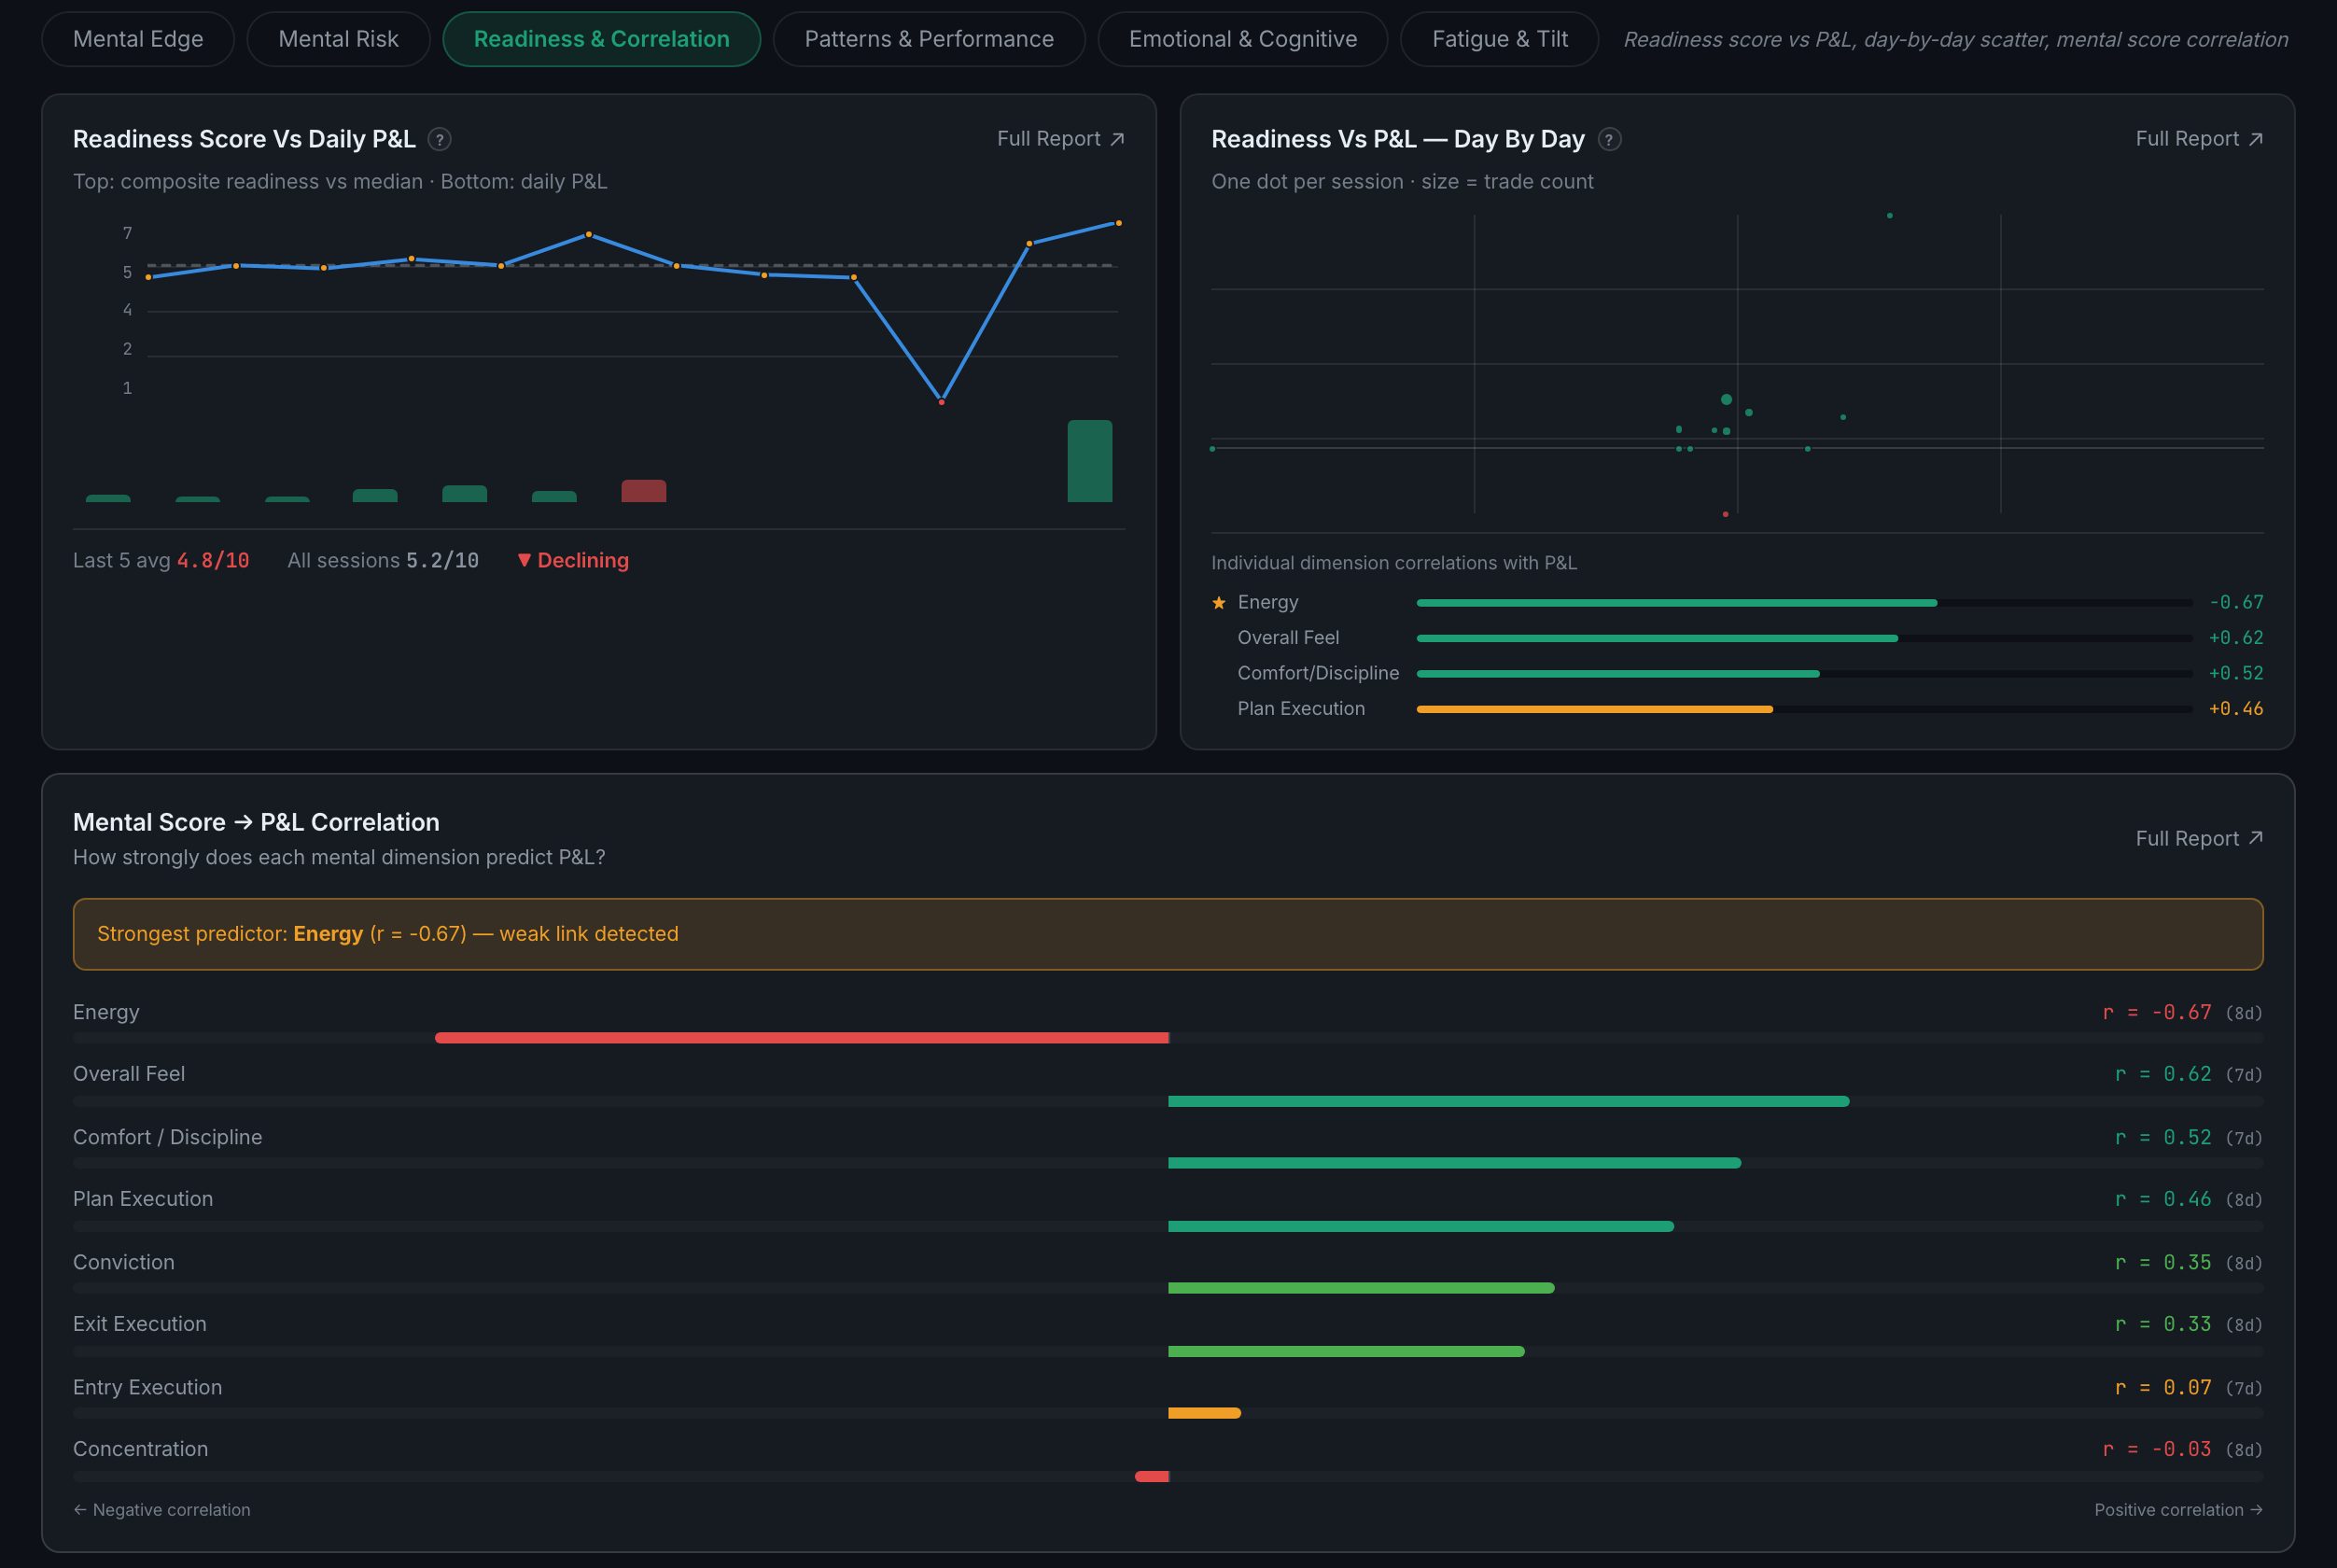
Does your pre-market readiness score actually predict the day — plotted three ways.
The narrowest and most testable question in the tab. You score yourself before the session; this checks whether that score was right. If the correlation is weak, the honest reading is that your scoring is not yet measuring the thing that matters — and that is worth knowing before acting on any of it.
Indicators on this sub-page:
- Readiness Score vs Daily P&LYour composite readiness plotted against your median on top and daily P&L as bars underneath, so a low-score day sits directly above the result it produced. It closes with your last-five average, your all-sessions average, and whether the trend is rising or declining.
- Readiness vs P&L — Day by DayOne dot per session, sized by how many trades were in it, with your four strongest dimension correlations listed beside it and the top one starred.
- Mental Score → P&L CorrelationEvery dimension ranked by correlation, each bar drawn left for negative and right for positive from a centre line, with the coefficient and the number of days behind it. A banner names your strongest predictor and, usefully, says when the link is weak rather than presenting it as a finding.
The day counts in brackets are the thing to check first. A correlation of −0.67 over eight days is a hint to keep scoring, not a conclusion about your energy.