What is on the Patterns & Performance sub-page?
Whether one trade affects the next — autocorrelation, physical readiness, what you do after a win or a loss, and how you perform across the segments of a session.
The most interesting sub-page in the tab, because it looks for dependence between trades. Trades should be independent; if yours are not, the mechanism is you.
Indicators on this sub-page:
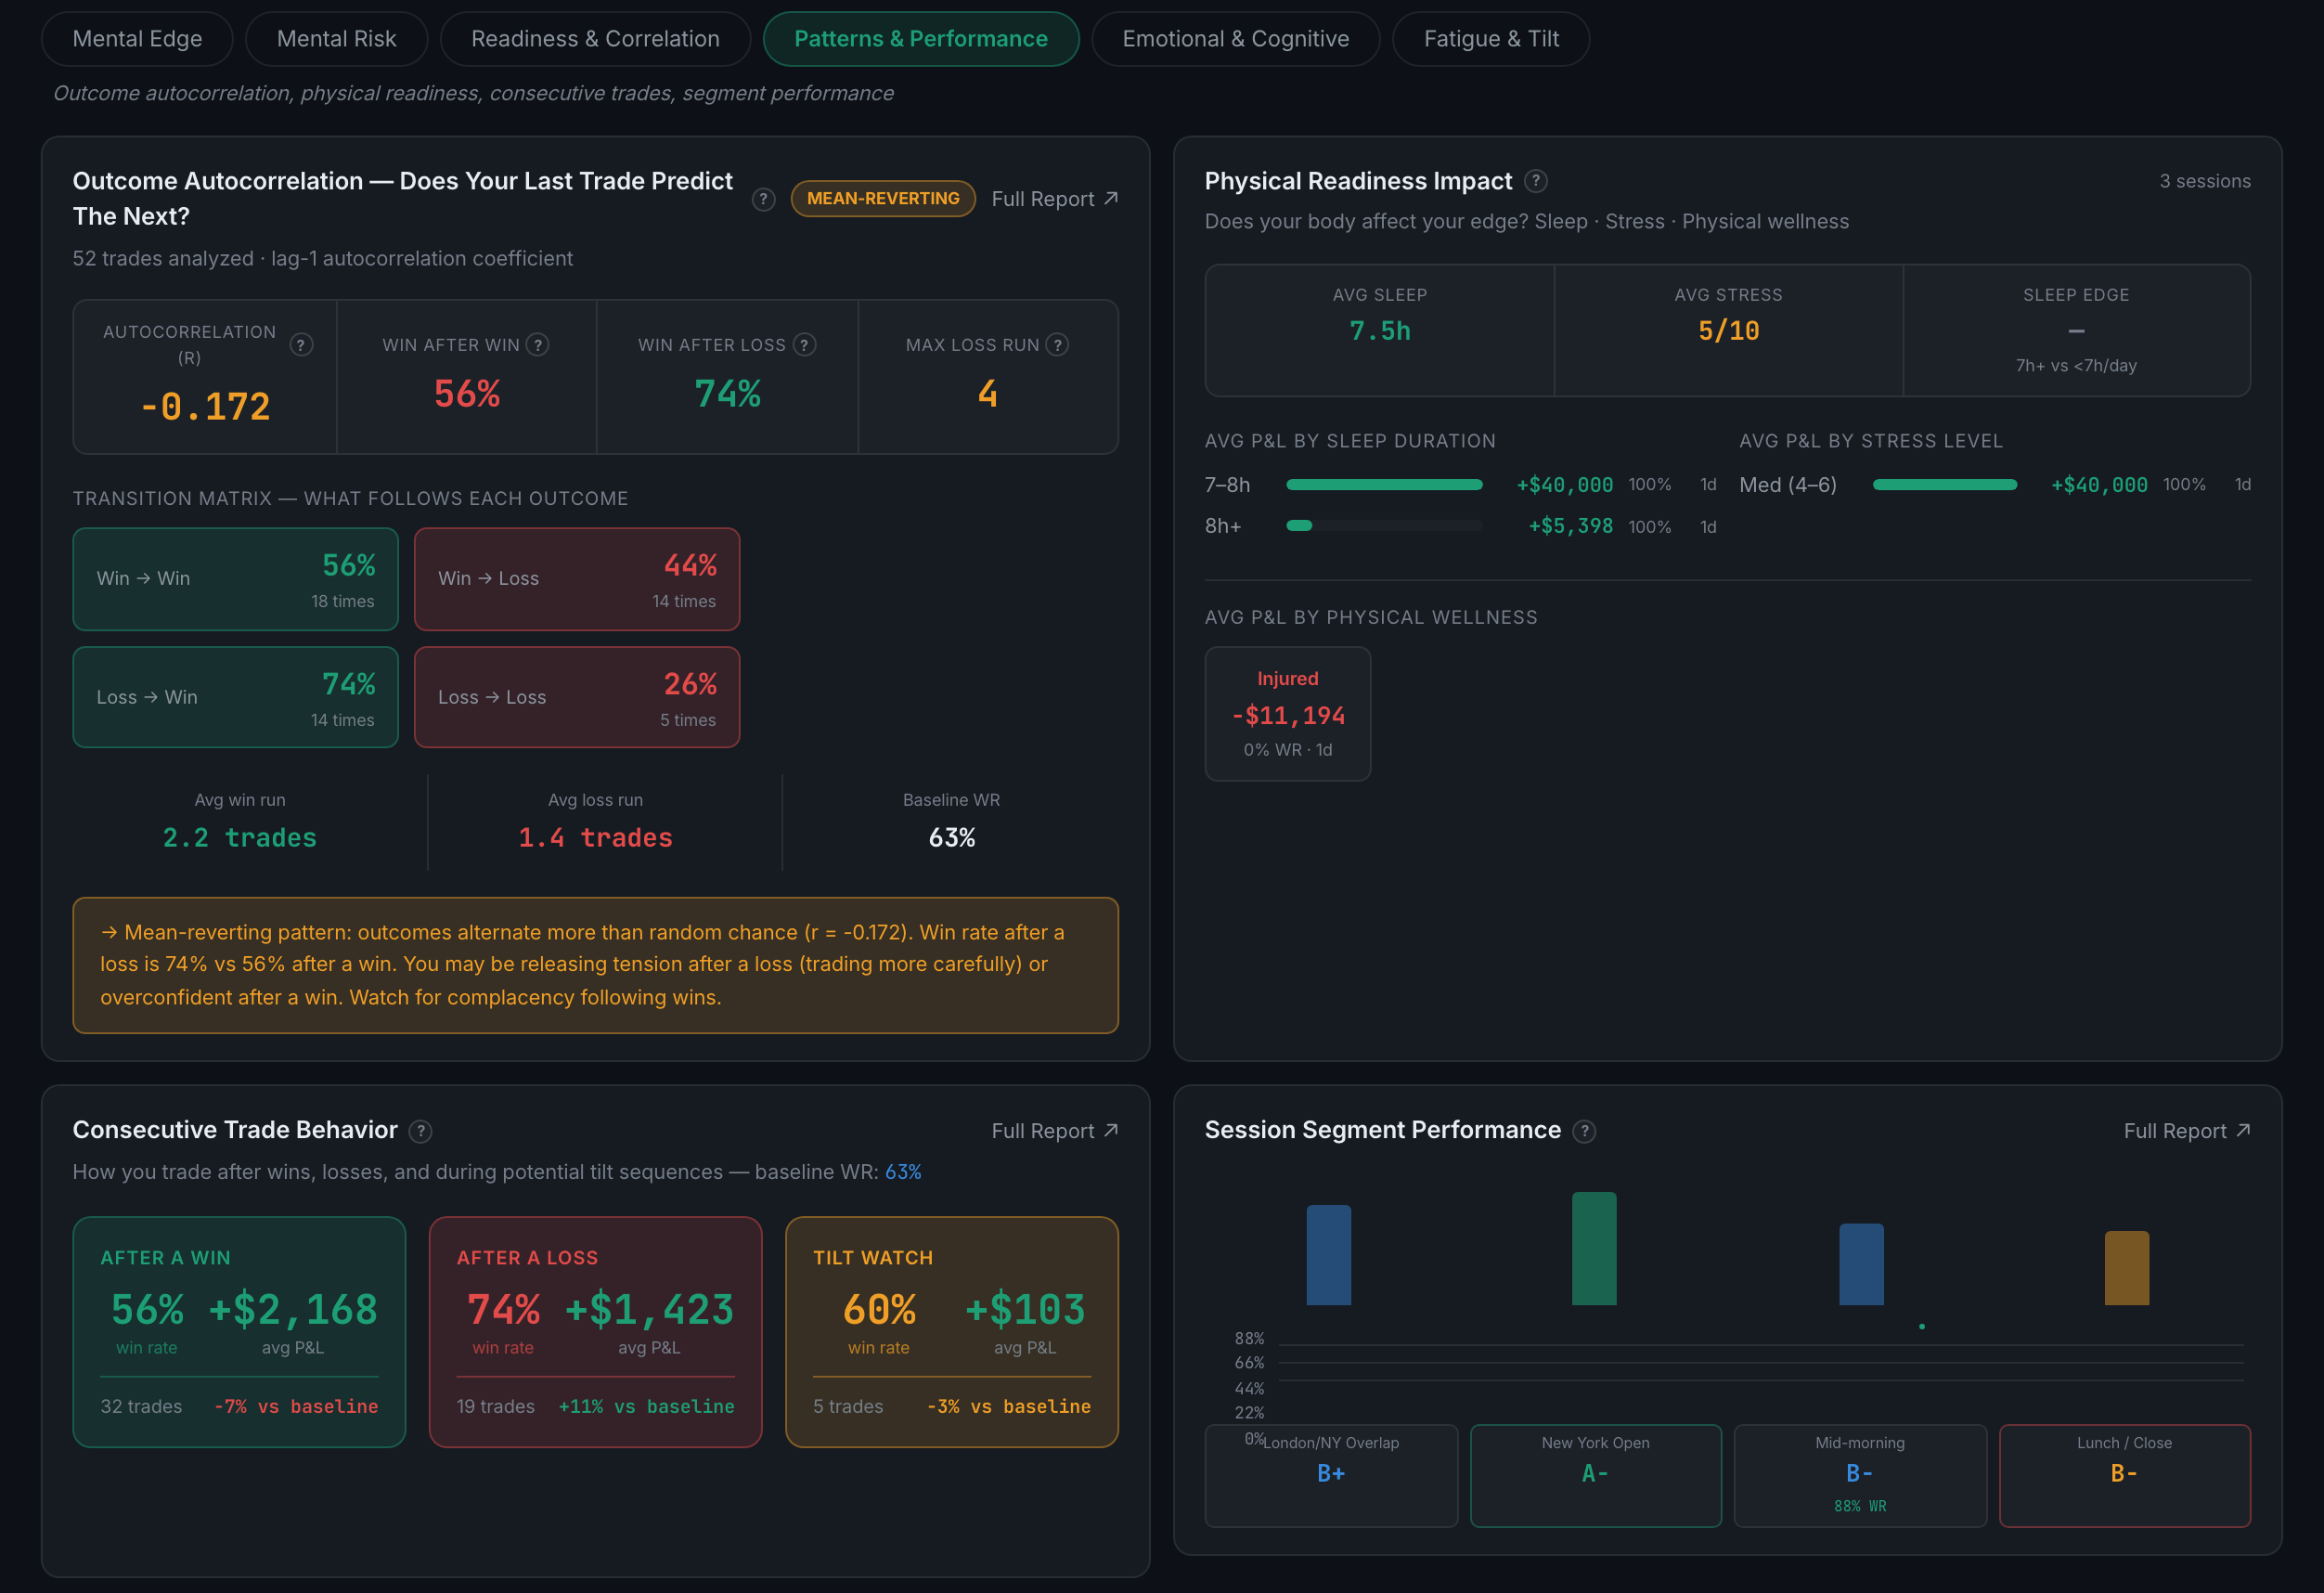
- Outcome Autocorrelation — Does Your Last Trade Predict the Next?Badged mean-reverting, trending or neutral, with the lag-1 coefficient, win rate after a win, win rate after a loss, and your longest loss run. Under it a transition matrix: win→win, win→loss, loss→win and loss→loss, each with a percentage and how many times it happened, plus your average win run, average loss run and baseline win rate. It closes by reading the pattern in plain English — a higher win rate after a loss than after a win is usually complacency following wins, not skill following losses.
- Physical Readiness ImpactAverage sleep, average stress and the sleep edge (7h+ against under 7h), then average P&L by sleep duration band, by stress level, and by physical wellness. The session count sits in the corner, and it is usually small — treat this as a prompt to keep logging rather than a result.
- Consecutive Trade BehaviorThree cohorts: after a win, after a loss, and tilt watch, each with win rate, average P&L, trade count, and how far it sits from your baseline win rate. The baseline is stated at the top so the comparisons mean something.
- Session Segment PerformanceThe session cut into segments — London/NY overlap, New York open, mid-morning, lunch and close — each given a letter grade with its win rate. A specific segment can then be dropped rather than the whole day written off.