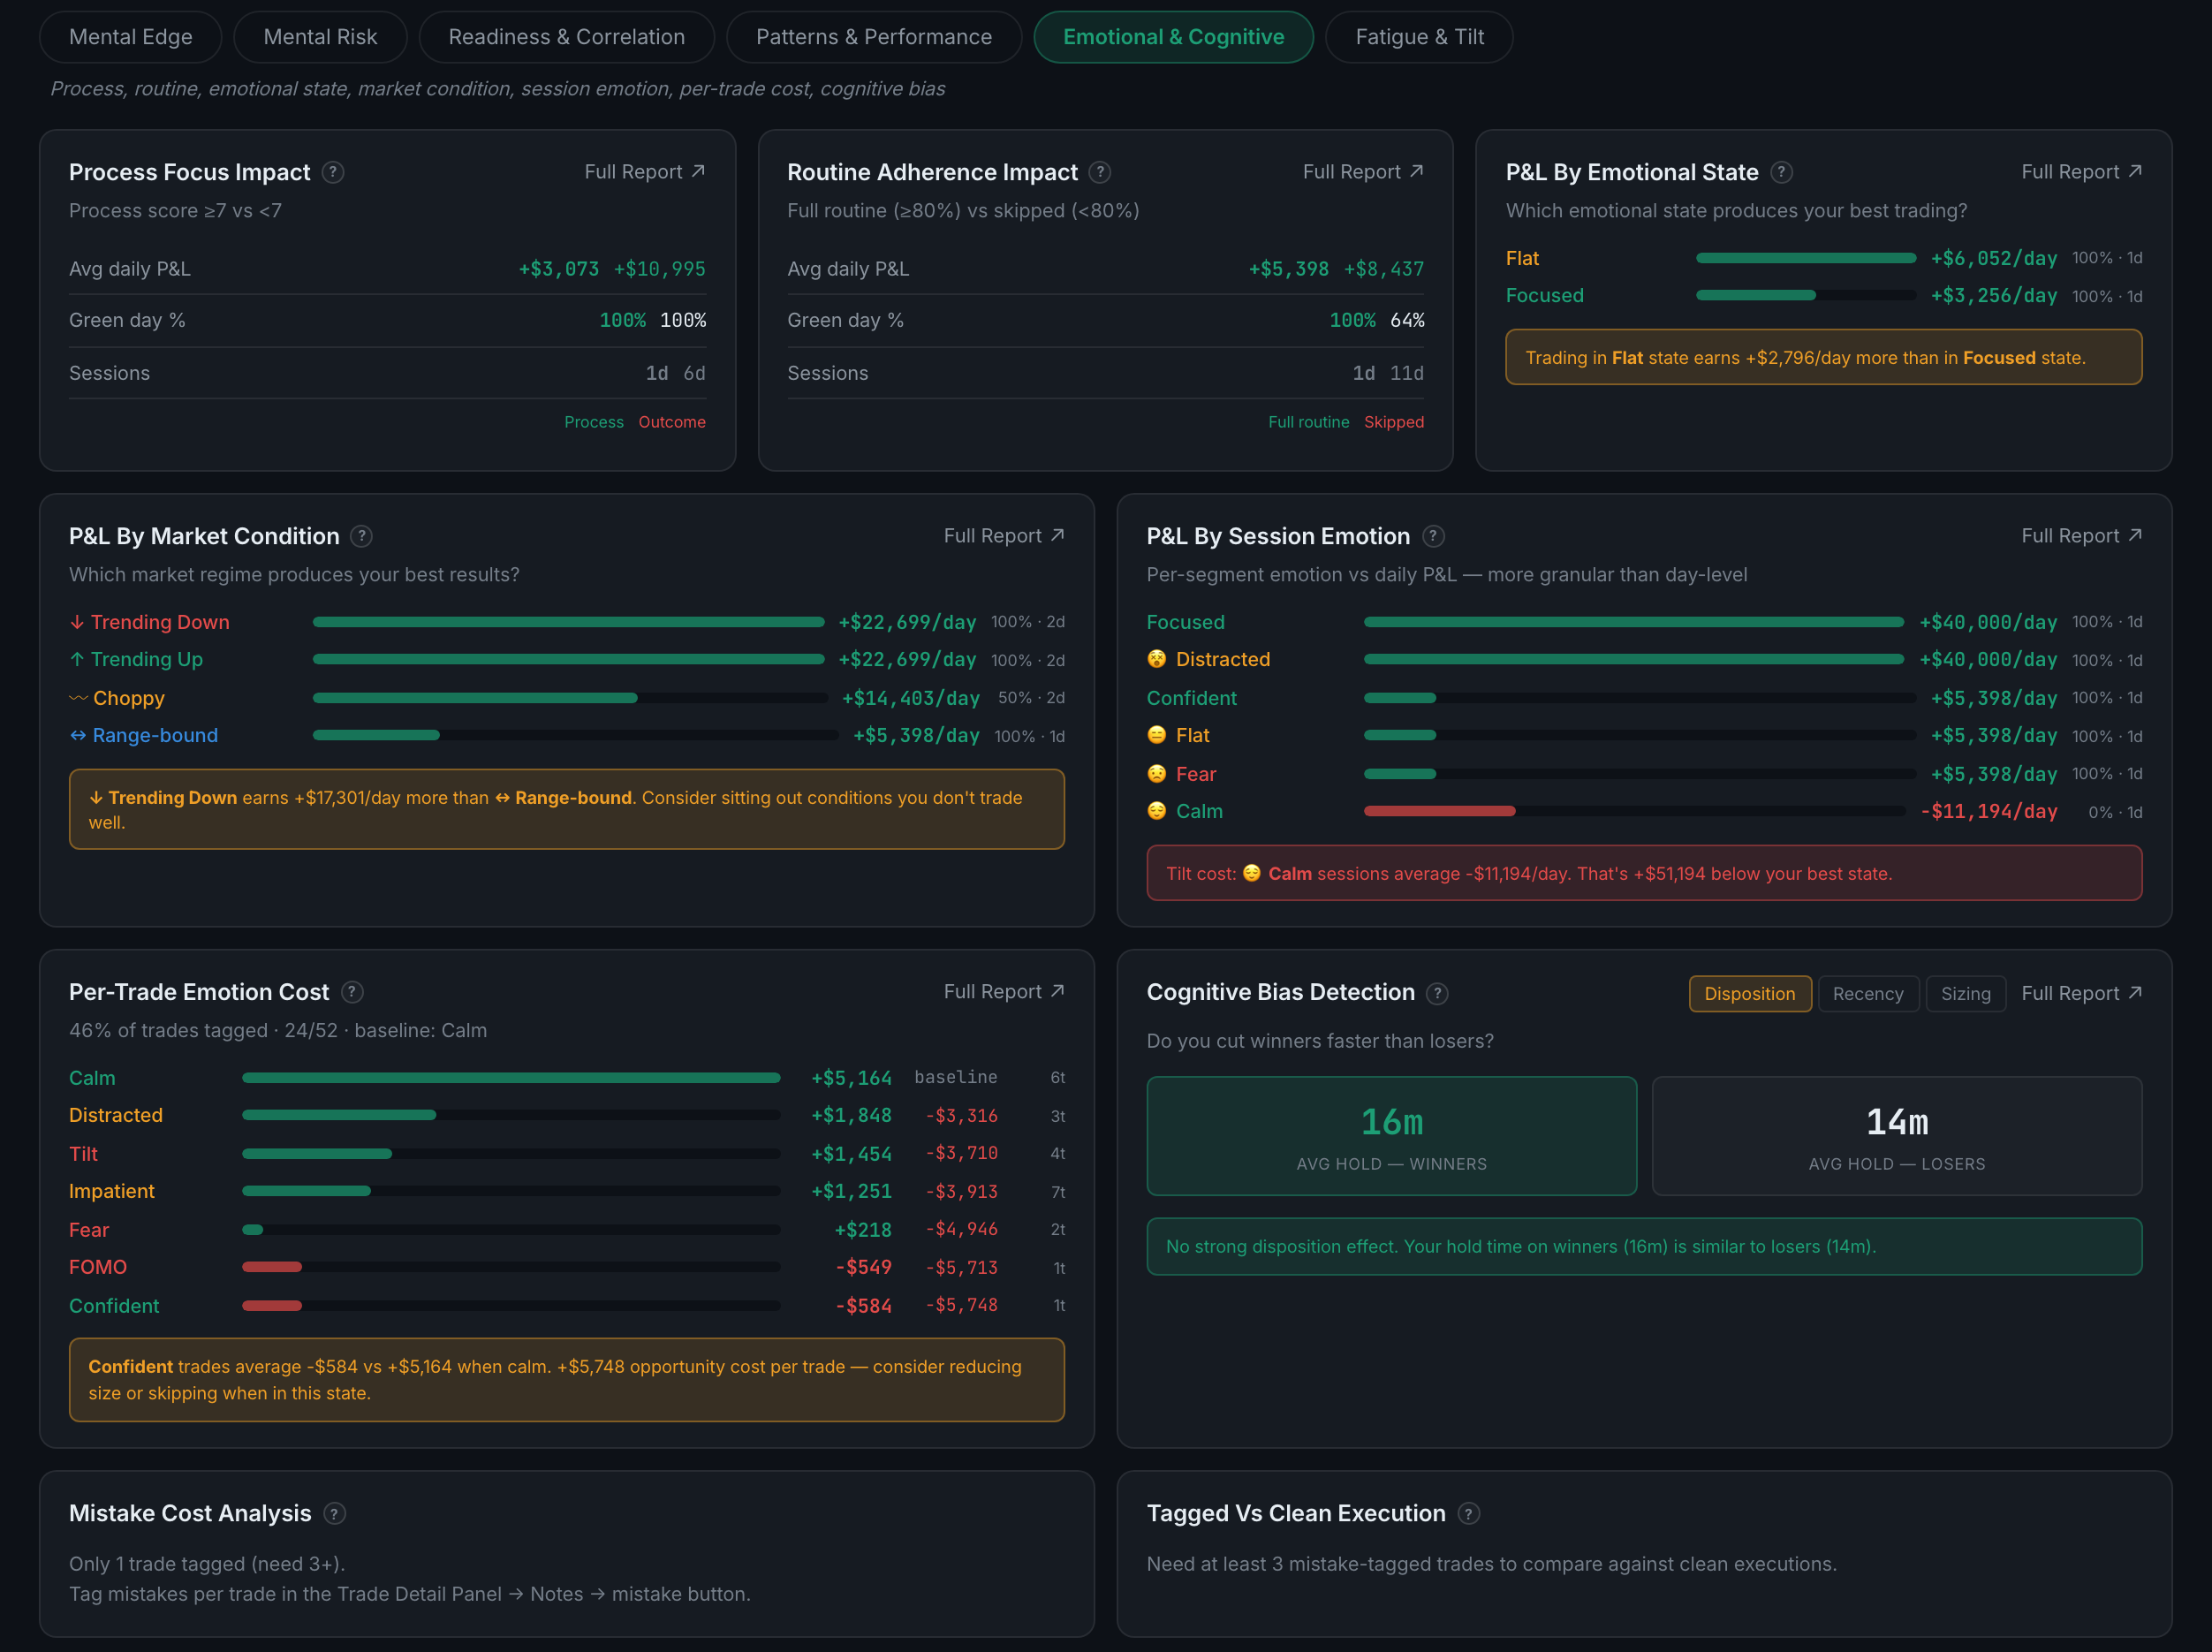
What is on the Emotional & Cognitive sub-page?
Nine panels on what you felt and what it cost — emotional state, market condition, process focus, routine adherence, per-trade emotion cost and cognitive bias detection. Seven Full Reports, the most in the app.
This is the sub-page that converts the qualitative parts of your debrief into money. Every field you fill in on a report card ends up in one of these panels.
Indicators on this sub-page:
- Process Focus ImpactDays you scored 7 or more on process against days you scored under 7, compared on average daily P&L, green-day percentage and session count.
- Routine Adherence ImpactThe same shape, splitting days where you completed 80% or more of your routine from days you skipped it.
- P&L by Emotional StateYour logged states ranked by what each earns per day, closing with the gap between your best and second-best in money.
- P&L by Market ConditionTrending up, trending down, choppy and range-bound, each with a daily average, win rate and day count, and a line naming the regime to sit out.
- P&L by Session EmotionThe same per session rather than per day, which is finer grained, and it closes with a tilt cost: what your worst state averages, and how far below your best that is.
- Per-Trade Emotion CostEvery state with its average per trade, its gap against your baseline state, and how many trades carry that tag. The header states what share of your trades are tagged at all — 46%, 24 of 52 — which is the number that decides how much of the rest to believe.
- Cognitive Bias DetectionThree biases behind a toggle: disposition (do you cut winners faster than losers, answered with average hold on winners against losers), recency and sizing. It is willing to report the absence of a bias, which is the useful behaviour.
- Mistake Cost Analysis and Tagged vs Clean Execution — mistake-tagged trades against your clean ones. Needs at least three mistake-tagged trades, added per trade in the Trade Detail Panel → Notes → mistake button. Both tell you the count you currently have.