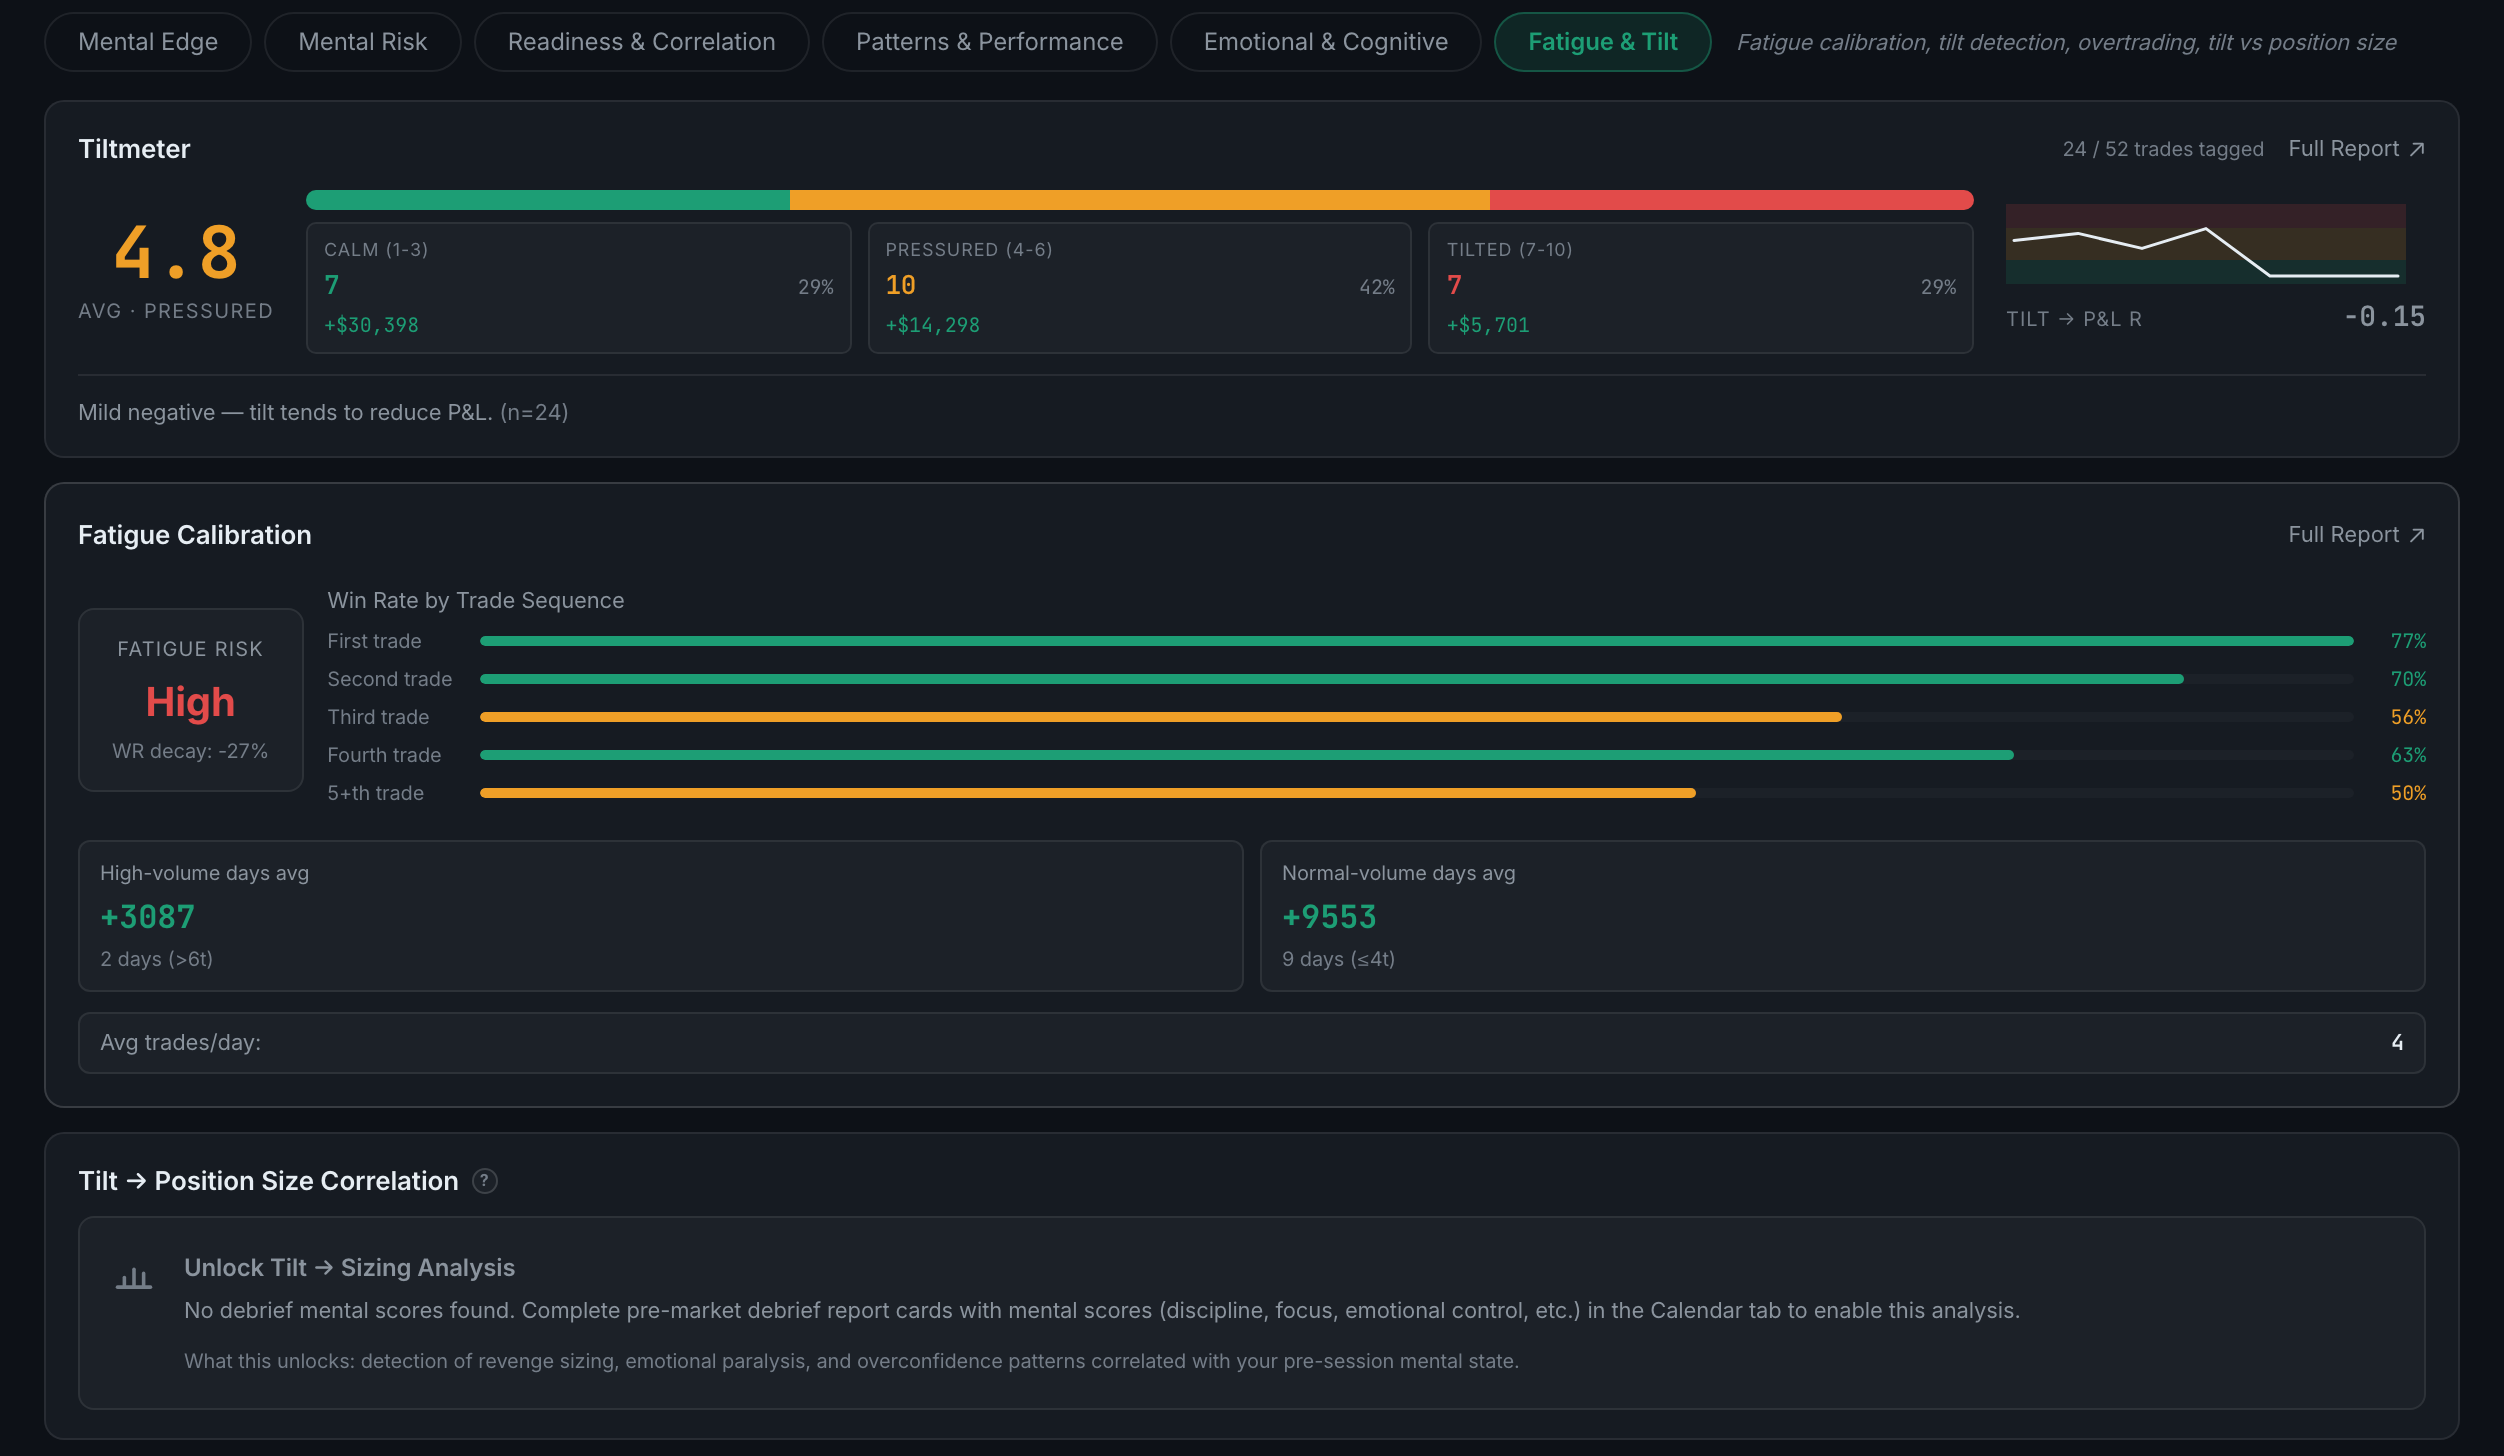
What is on the Fatigue & Tilt sub-page?
A tilt meter, a check on whether your fatigue self-scores are accurate, and the correlation between tilt and how big you go.
Three panels, and the third is the one that matters. Tilt costs money in two ways: the trades you take, and the size you take them at. Almost everyone measures the first and almost nobody measures the second.
Indicators on this sub-page:
- TiltmeterYour average tilt score out of ten with a band name, and your trades split across three bands: calm (1–3), pressured (4–6) and tilted (7–10), each with a trade count, a share and the P&L earned in that state. Beside them, the correlation between tilt and P&L in R, and a plain reading of it. The header states how many of your trades are tagged at all — 24 of 52 — which is the number that decides how much of the rest to believe.
- Fatigue CalibrationA fatigue risk rating with the win-rate decay behind it, then win rate by trade sequence: your first trade of the day, your second, third, fourth and fifth or later. Under that, your average on high-volume days against normal-volume days, with the day counts and the thresholds, and your average trades per day. A steady slide from the first trade to the fifth is the whole argument for a daily trade cap.
- Tilt → Position Size CorrelationWhether your position size rises as your tilt rises. It stays locked with an Unlock Tilt → Sizing Analysis prompt, and unusually it tells you what you would get for the effort: detection of revenge sizing, emotional paralysis, and overconfidence patterns against your pre-session state.
That last panel needs pre-market debrief report cards with mental scores — discipline, focus, emotional control — filled in from the Calendar tab. Without them it says so plainly rather than drawing an empty chart.