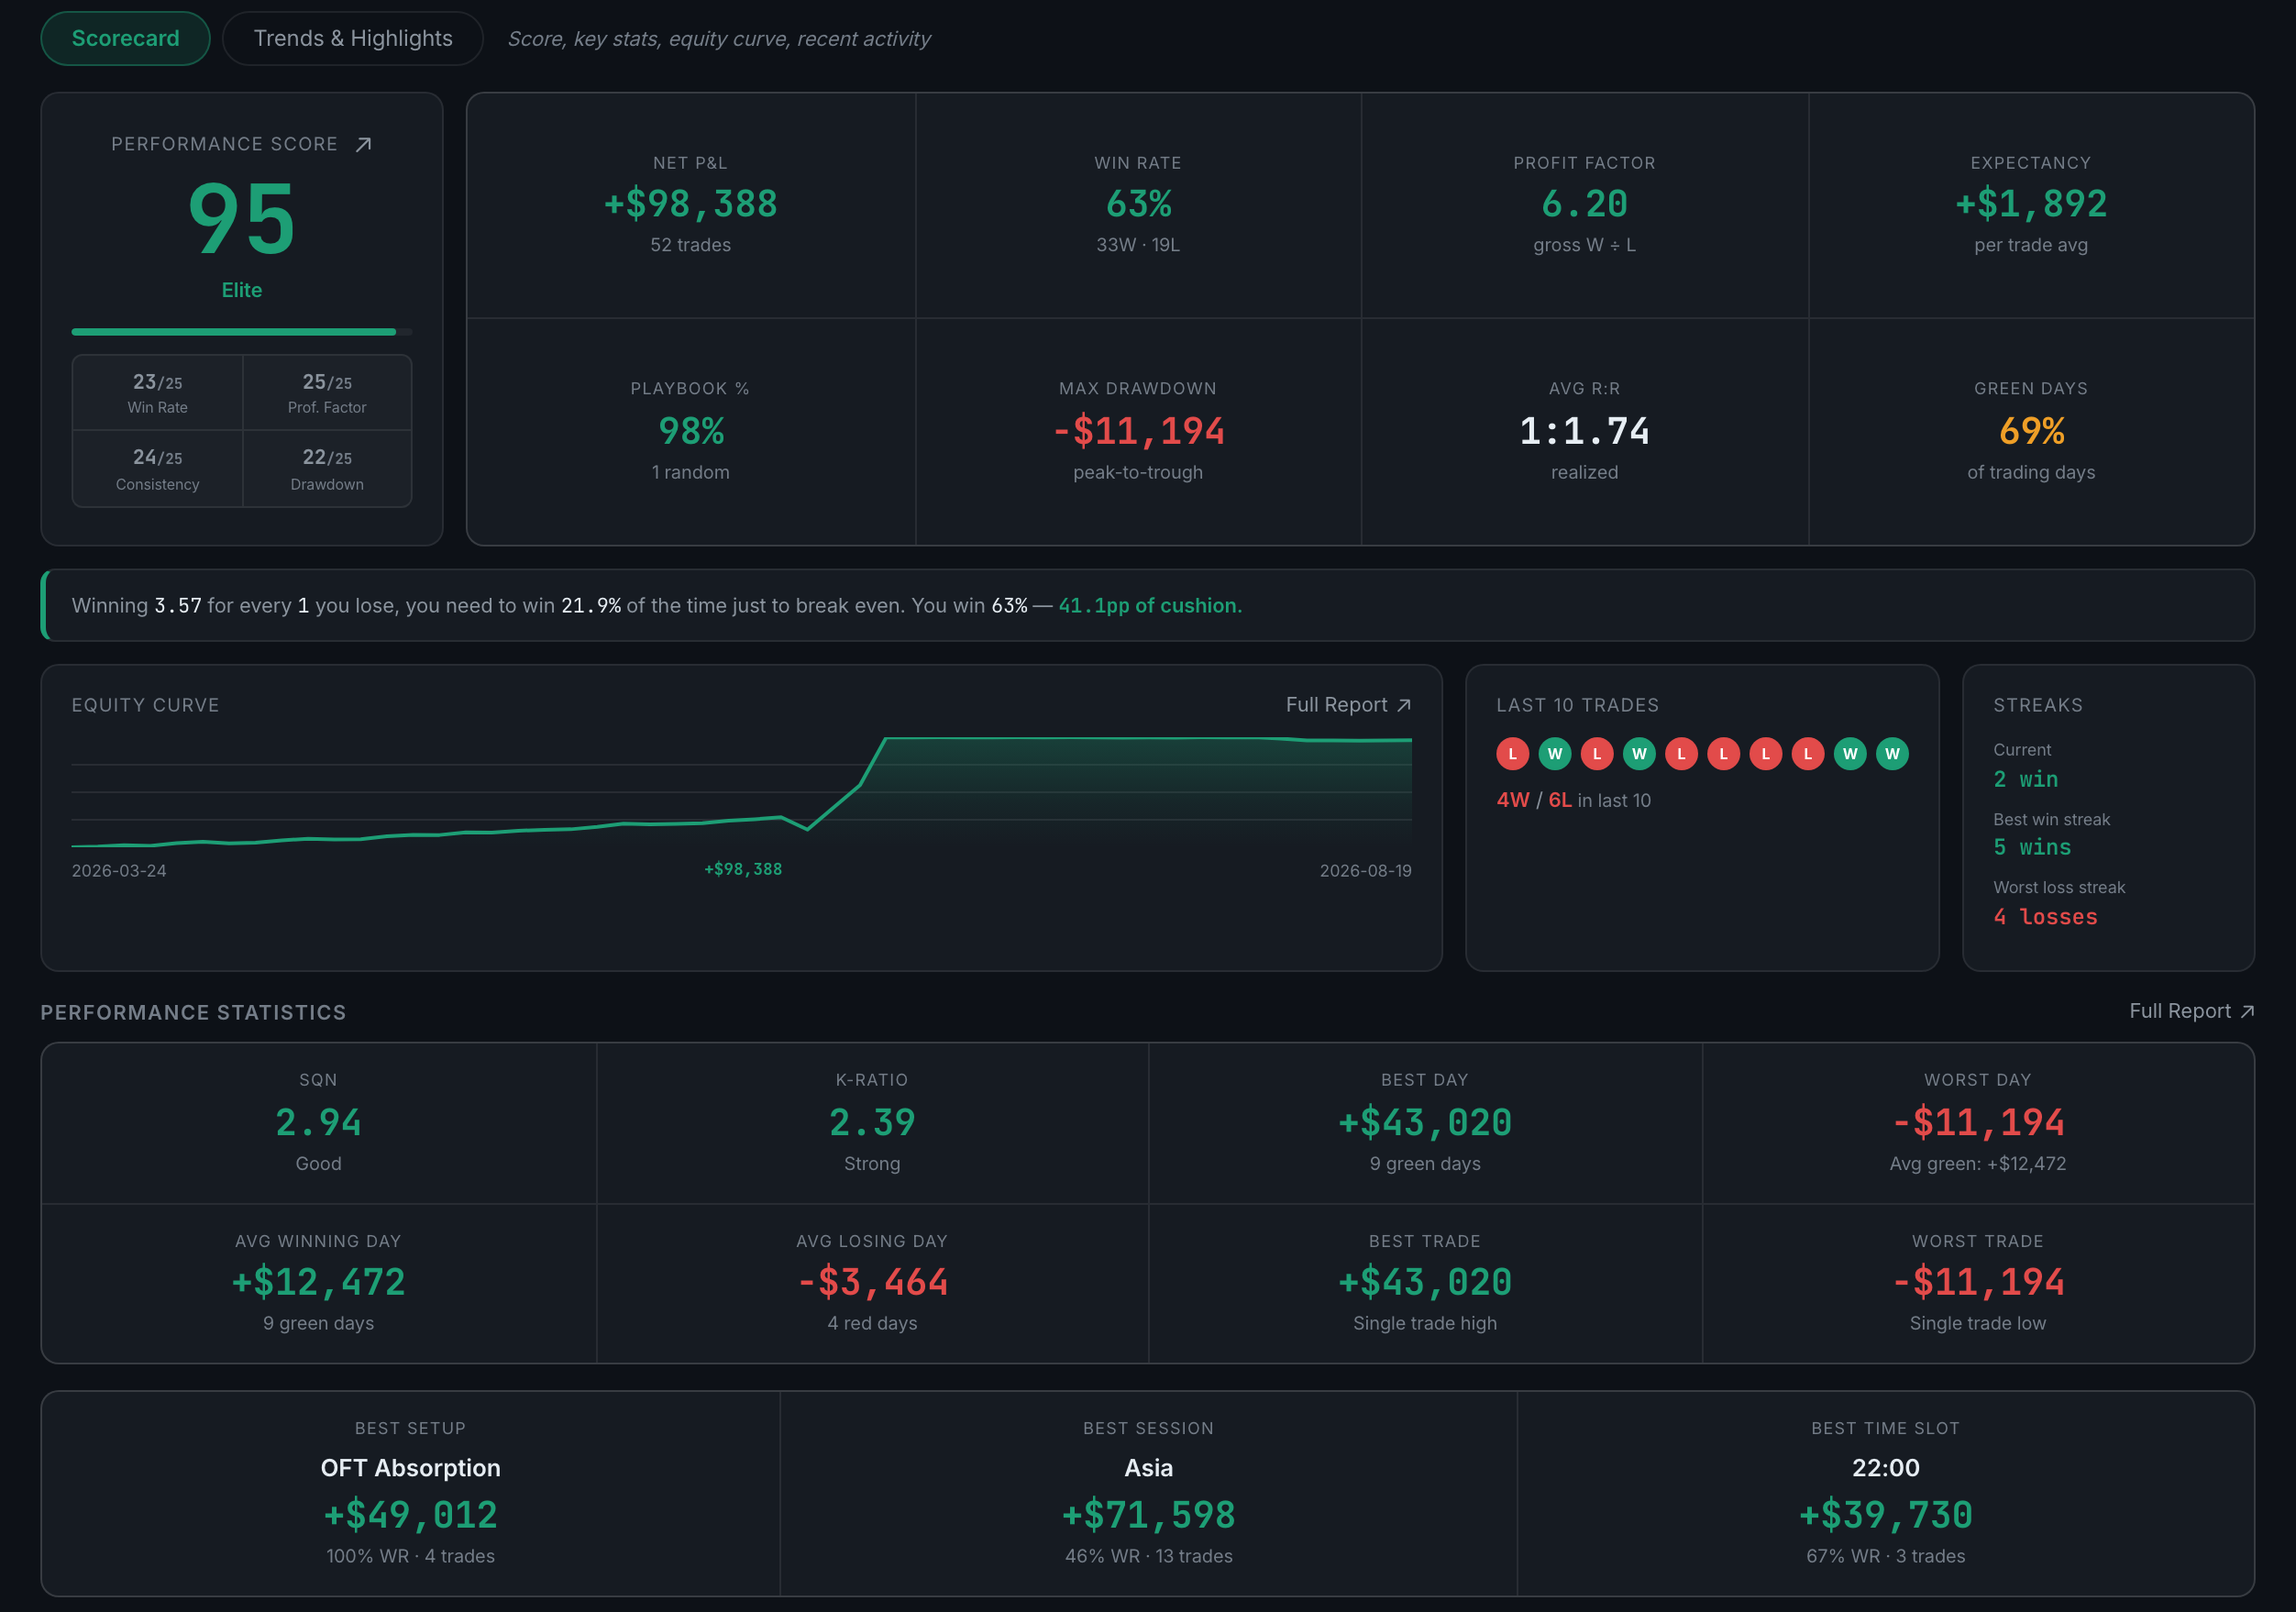
What is on the Scorecard sub-page?
Your 0–100 Performance Score with the four components that make it, the headline stats grid, the break-even honesty line, your equity curve and your recent trades.
This is the front page of the whole app's analysis, and it is built to be read in about ten seconds. One number tells you where you stand, eight tell you why, and the curve tells you whether it is going the right way.
Indicators on this sub-page:
- Performance Score0–100, assembled from four components scored out of 25 each. The score has its own Full Report, which is where the arithmetic is shown.
- The key stats gridNet P&L, win rate, profit factor, expectancy per trade, playbook adherence percentage, max drawdown, average R:R and green-day percentage.
- The break-even honesty lineHow much you need to make back to be flat, stated in plain money. It only renders once there is a loss to recover.
- Equity Curve, with Last 10 Trades and Streaks beside it — the running total, your last ten results as a row of W/L markers, and your current, best and worst streaks. A kink in the curve has trades next to it rather than needing to be looked up.
- Performance StatisticsThe fuller table under the fold, with its own Full Report.