What is on the Volatility Regime sub-page?
Whether your execution holds up when the market gets fast — results and stop adherence split by ATR regime.
Most execution problems are conditional. A trader with clean discipline in a quiet market can be a different trader in a volatile one, and averaging the two together hides it completely. This sub-page splits by measured volatility rather than by memory.
Indicators on this sub-page:
- Volatility Regime vs Execution QualityOne row per ATR regime, from calm to fast, each with win rate, average P&L, average MAE, average MFE, average hold time and average size. Above it sit your best and worst regime by win rate, your best by P&L, and how many trades were analysed; below it, the gap between best and worst. Six measures per regime is the point — it lets you see how your trading changes when the market speeds up, not just that it does.
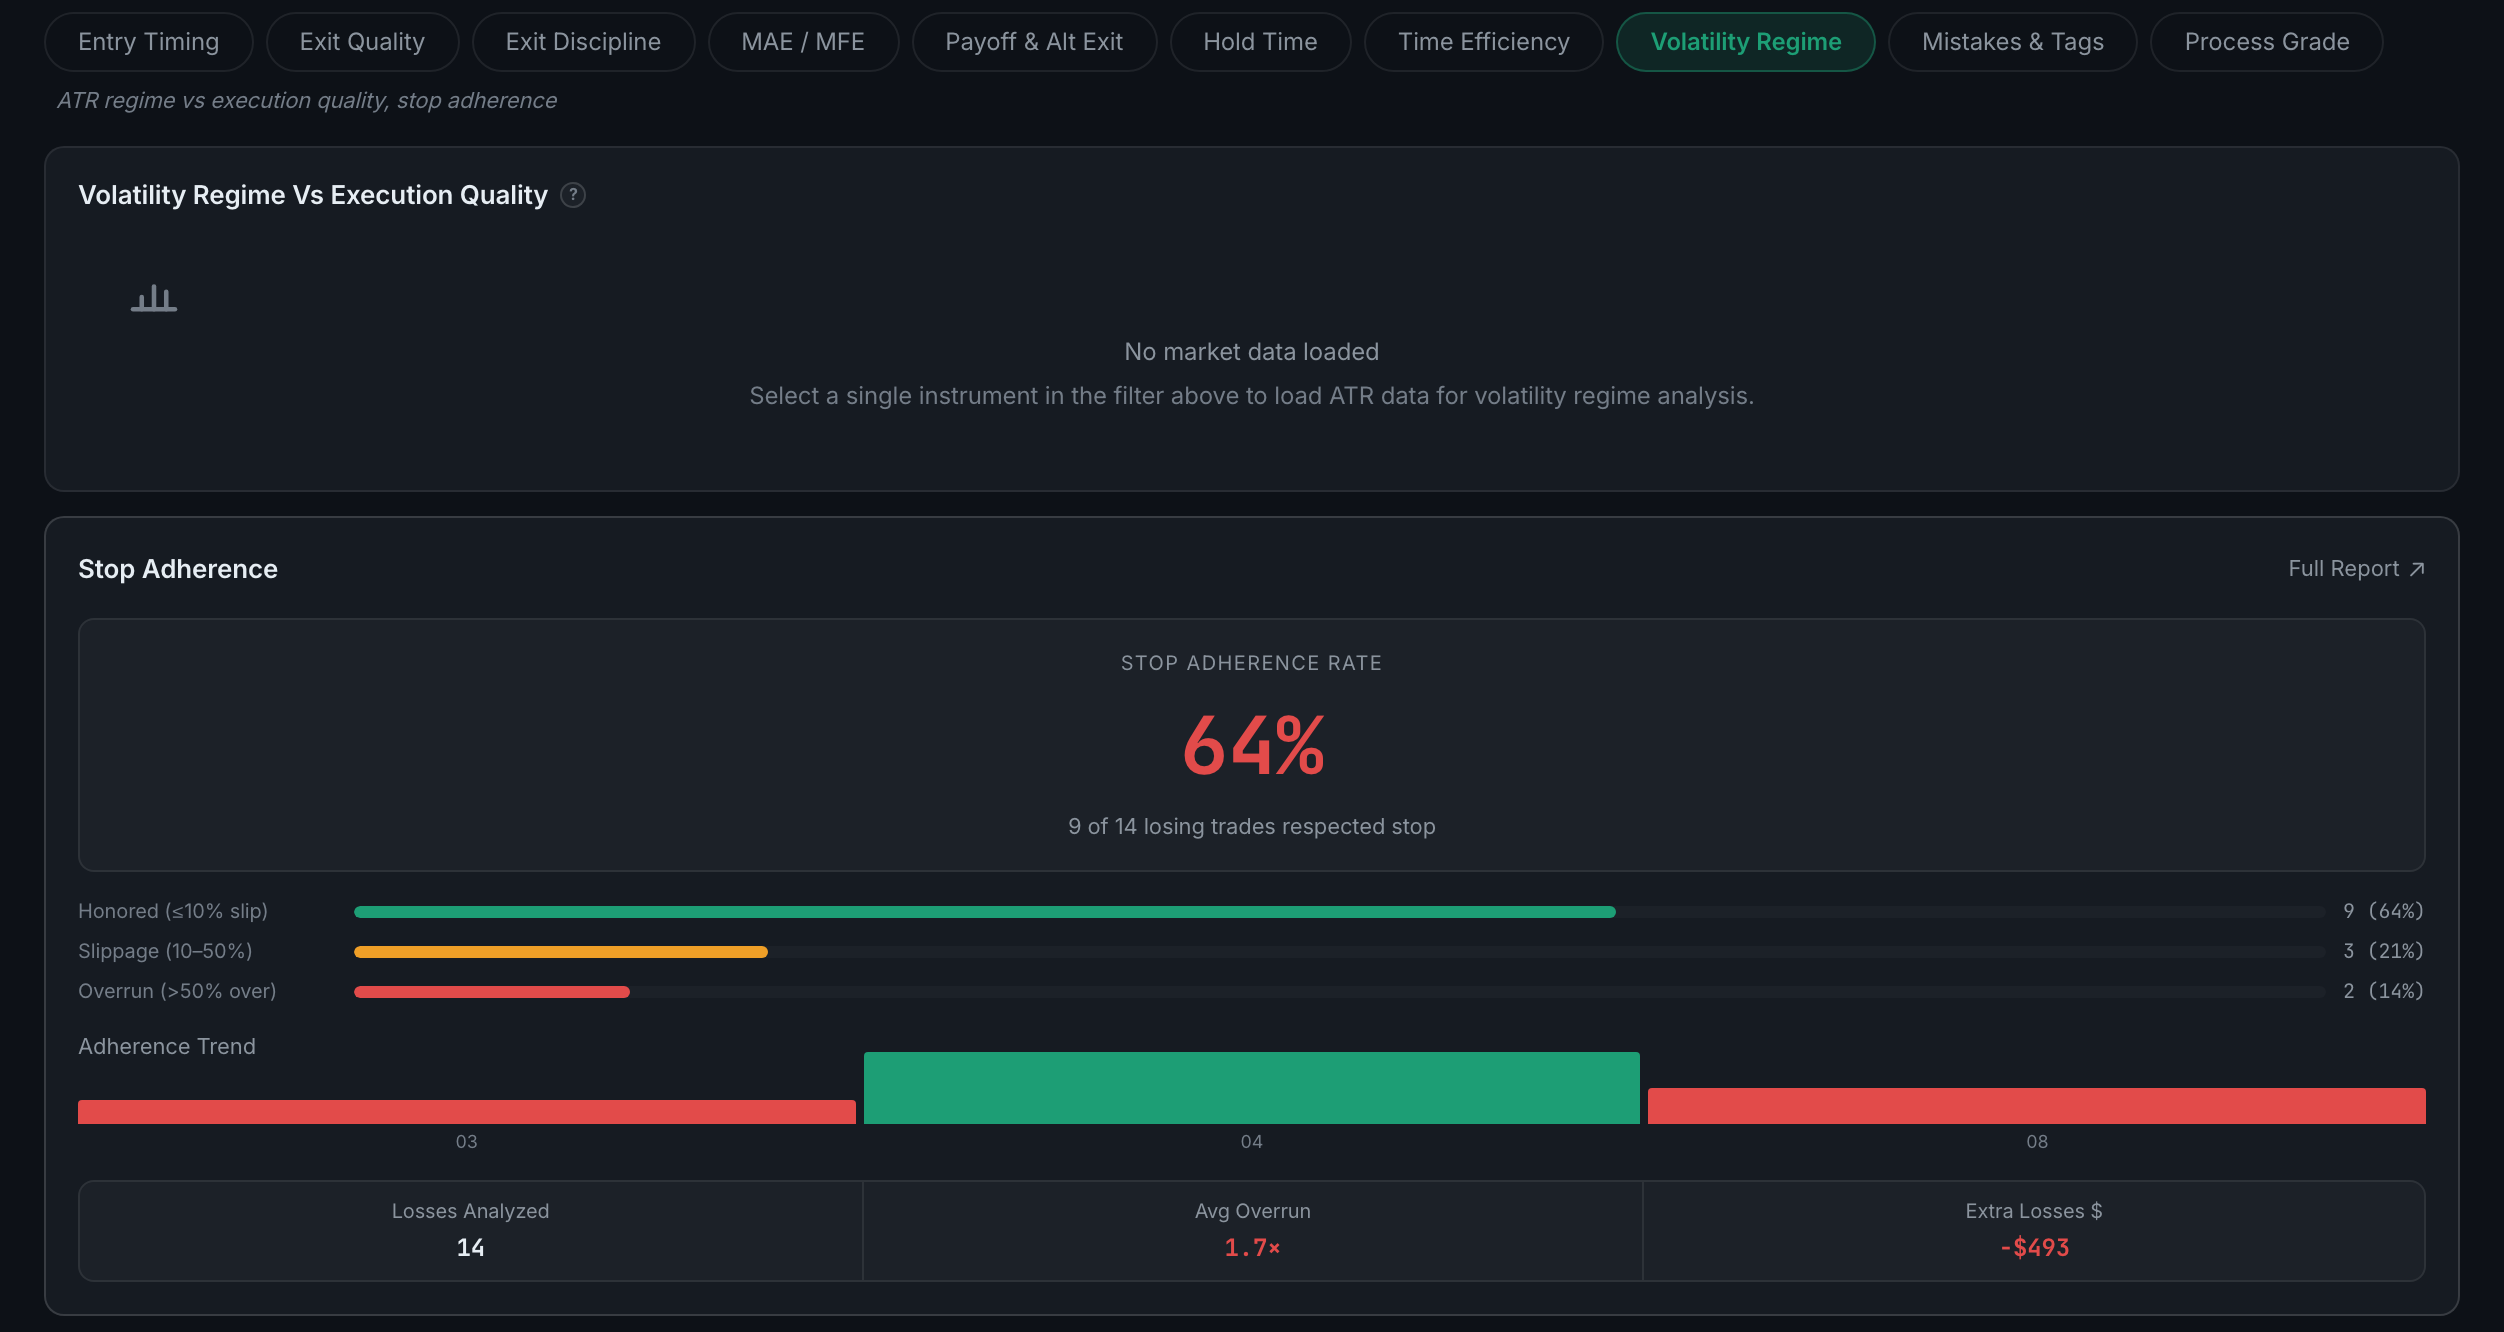
- Stop AdherenceYour adherence rate as a headline percentage with the fraction behind it ("9 of 14 losing trades respected stop"), then the three bands those losses fall into: honored at 10% slippage or less, slippage between 10% and 50%, and overrun at more than 50% over. Under that, an adherence trend by month, and three figures — losses analysed, average overrun as a multiple, and the extra money the overruns cost. Its Full Report adds benchmarks and adherence by setup, worst first, which is what names the setup you keep widening stops on.
The first panel needs a single instrument selected. ATR is instrument-specific, so with "All assets" in the filter row it has nothing to compute against and says "No market data loaded — select a single instrument in the filter above". Stop Adherence beneath it works regardless. This is the only sub-page in Analytics where the filter row is a precondition rather than a narrowing, and it is easy to mistake for a broken panel.