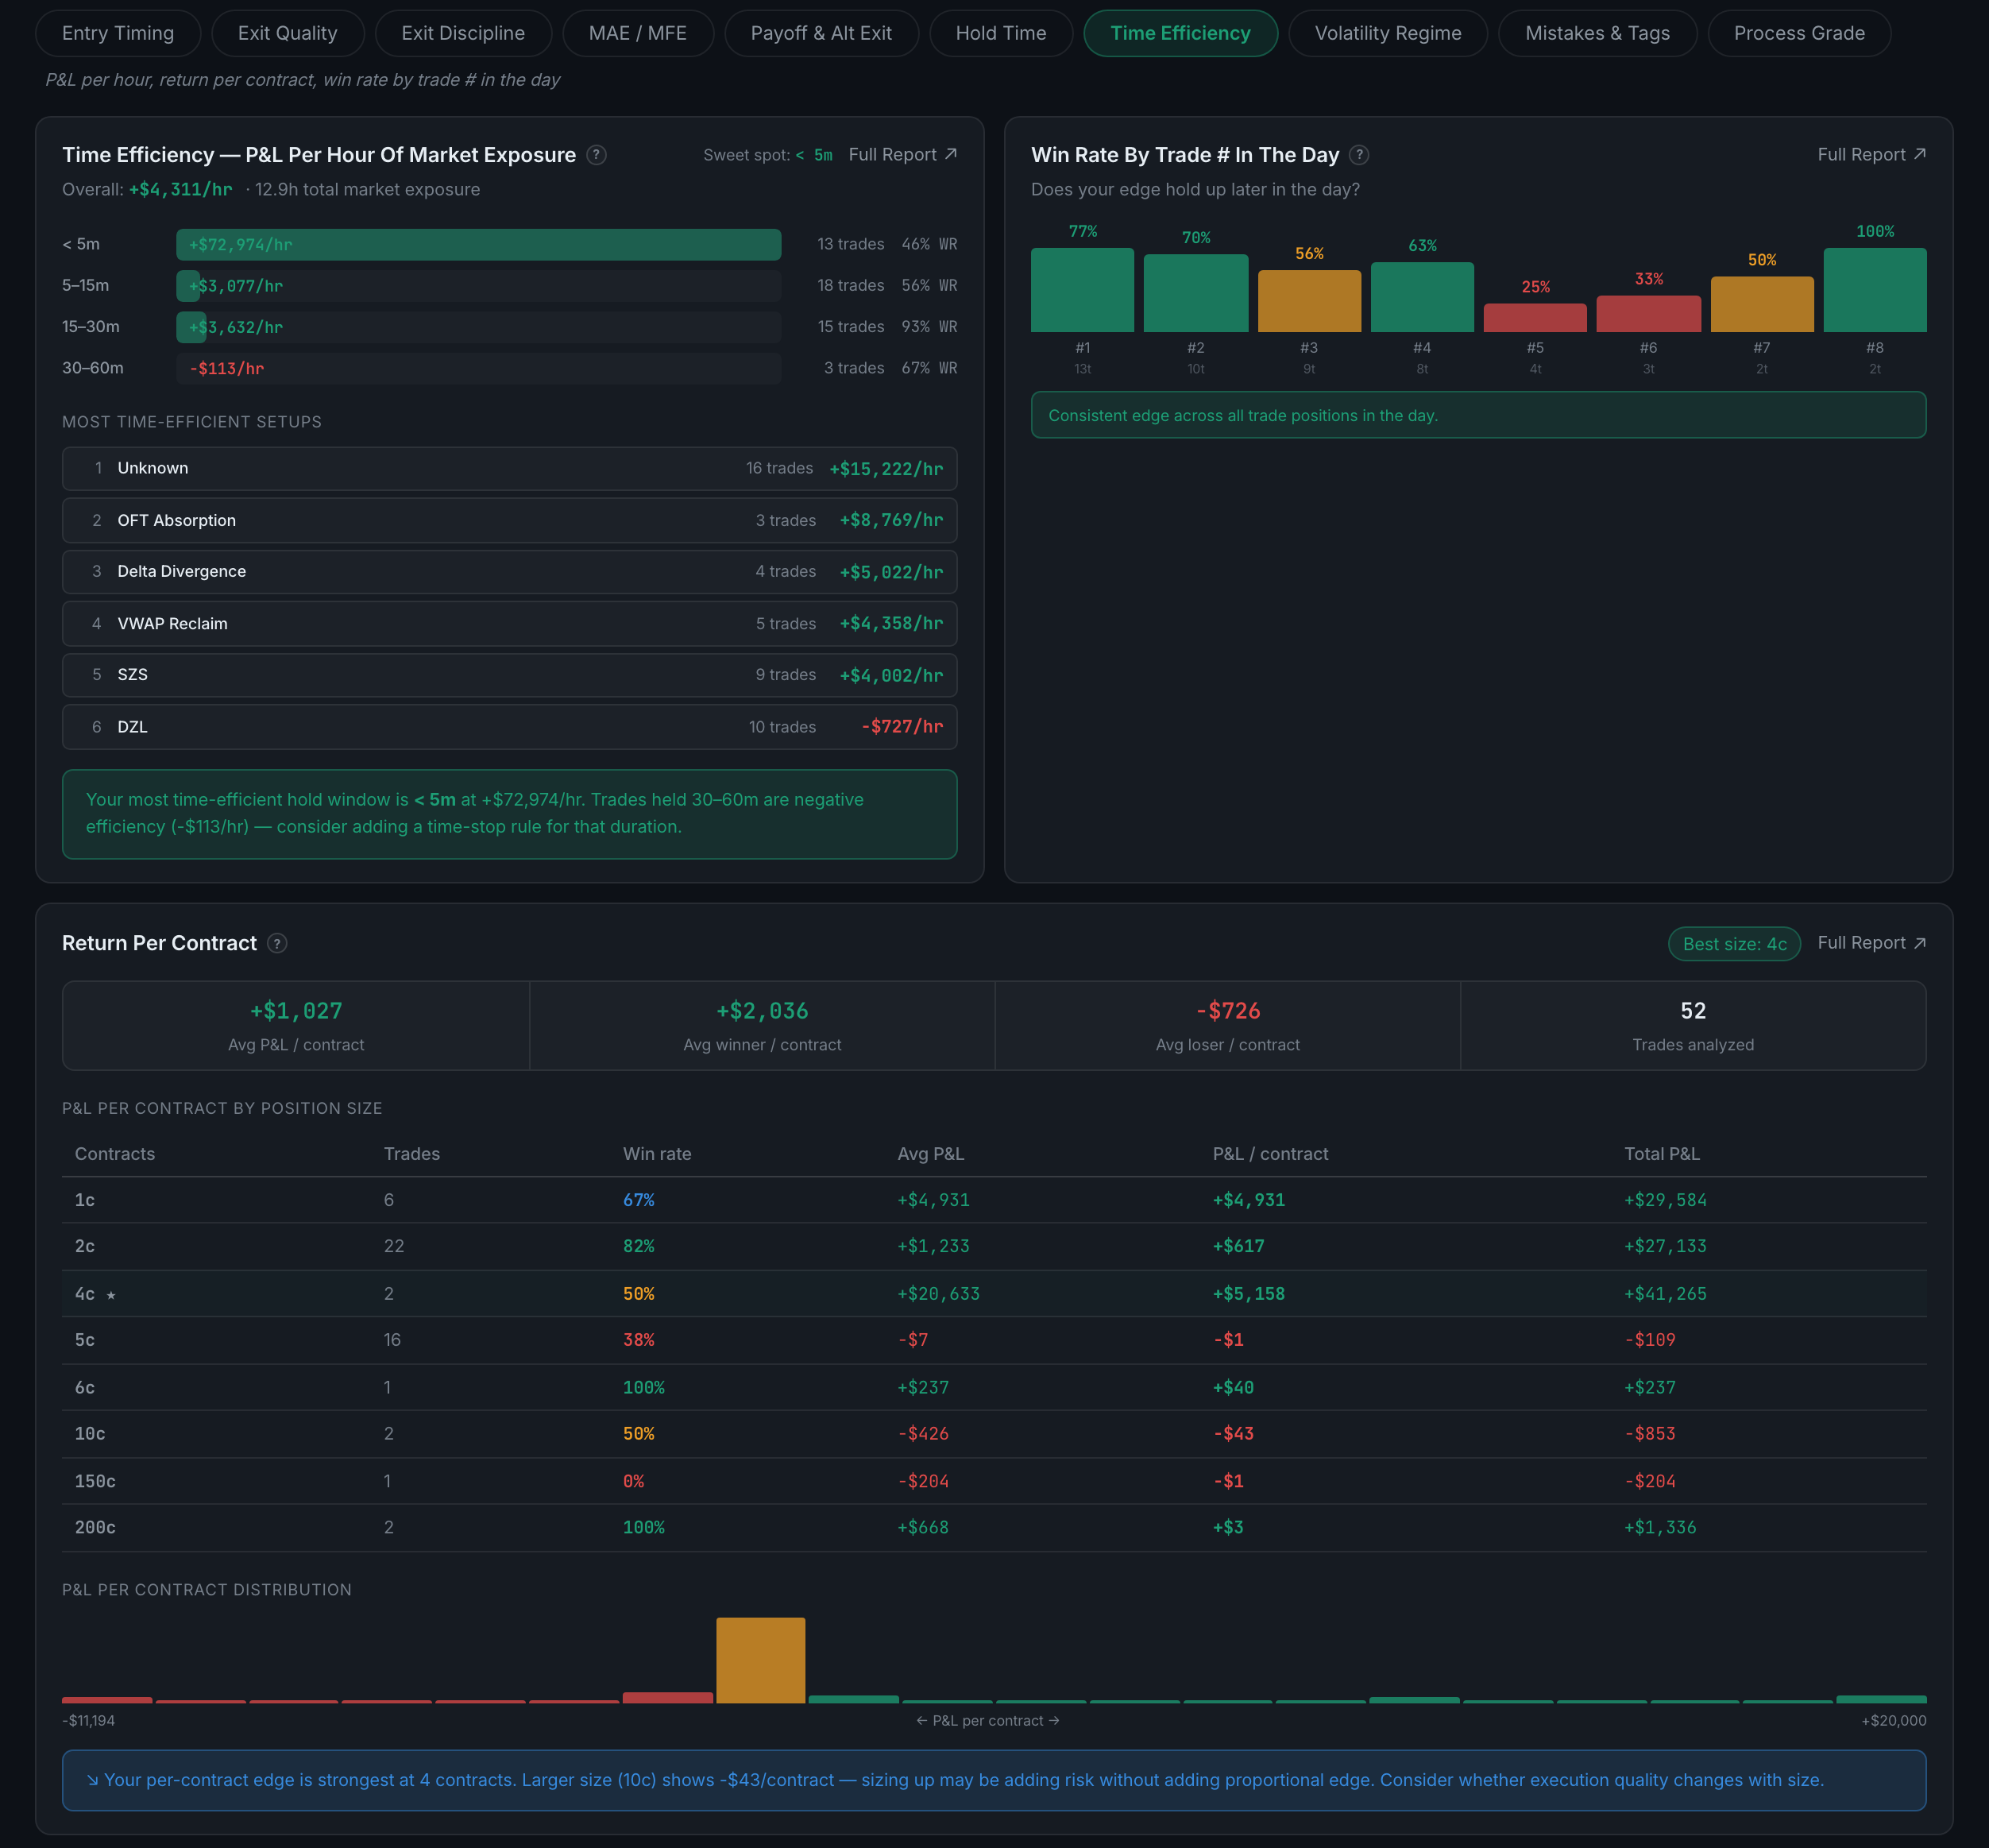
What is on the Time Efficiency sub-page?
What your time and your contracts actually earn — P&L per hour of exposure, win rate by trade number in the day, and return per contract.
Three different denominators, all asking whether you are being paid for what you are spending. Time is the one traders never price, and the trade-number panel is the closest thing the app has to an overtrading alarm inside the Execution tab.
Indicators on this sub-page:
- Time Efficiency — P&L per Hour of Market ExposureYour overall rate and total market exposure, then the rate per hold-time band with trade counts and win rates, your sweet spot named in the header, your most time-efficient setups ranked, and a closing recommendation — often a time-stop rule for the band that earns nothing.
- Win Rate by Trade # in the DayA bar per position in the day, first through eighth, each with its win rate and trade count, and a verdict on whether your edge holds across them. The point where this falls off is the point to stop at.
- Return per ContractAverage P&L per contract, per winning contract and per losing contract, with the trades analysed. Then P&L per contract by position size: a row per size with trades, win rate, average P&L, P&L per contract and total, your best size starred, and a distribution underneath. It closes by naming the size your edge is strongest at and warning when larger sizes stop paying proportionally.
That last table is the sharpest sizing evidence in the app, because it separates "I made more money on bigger trades" from "each contract earned more" — which are not the same claim.