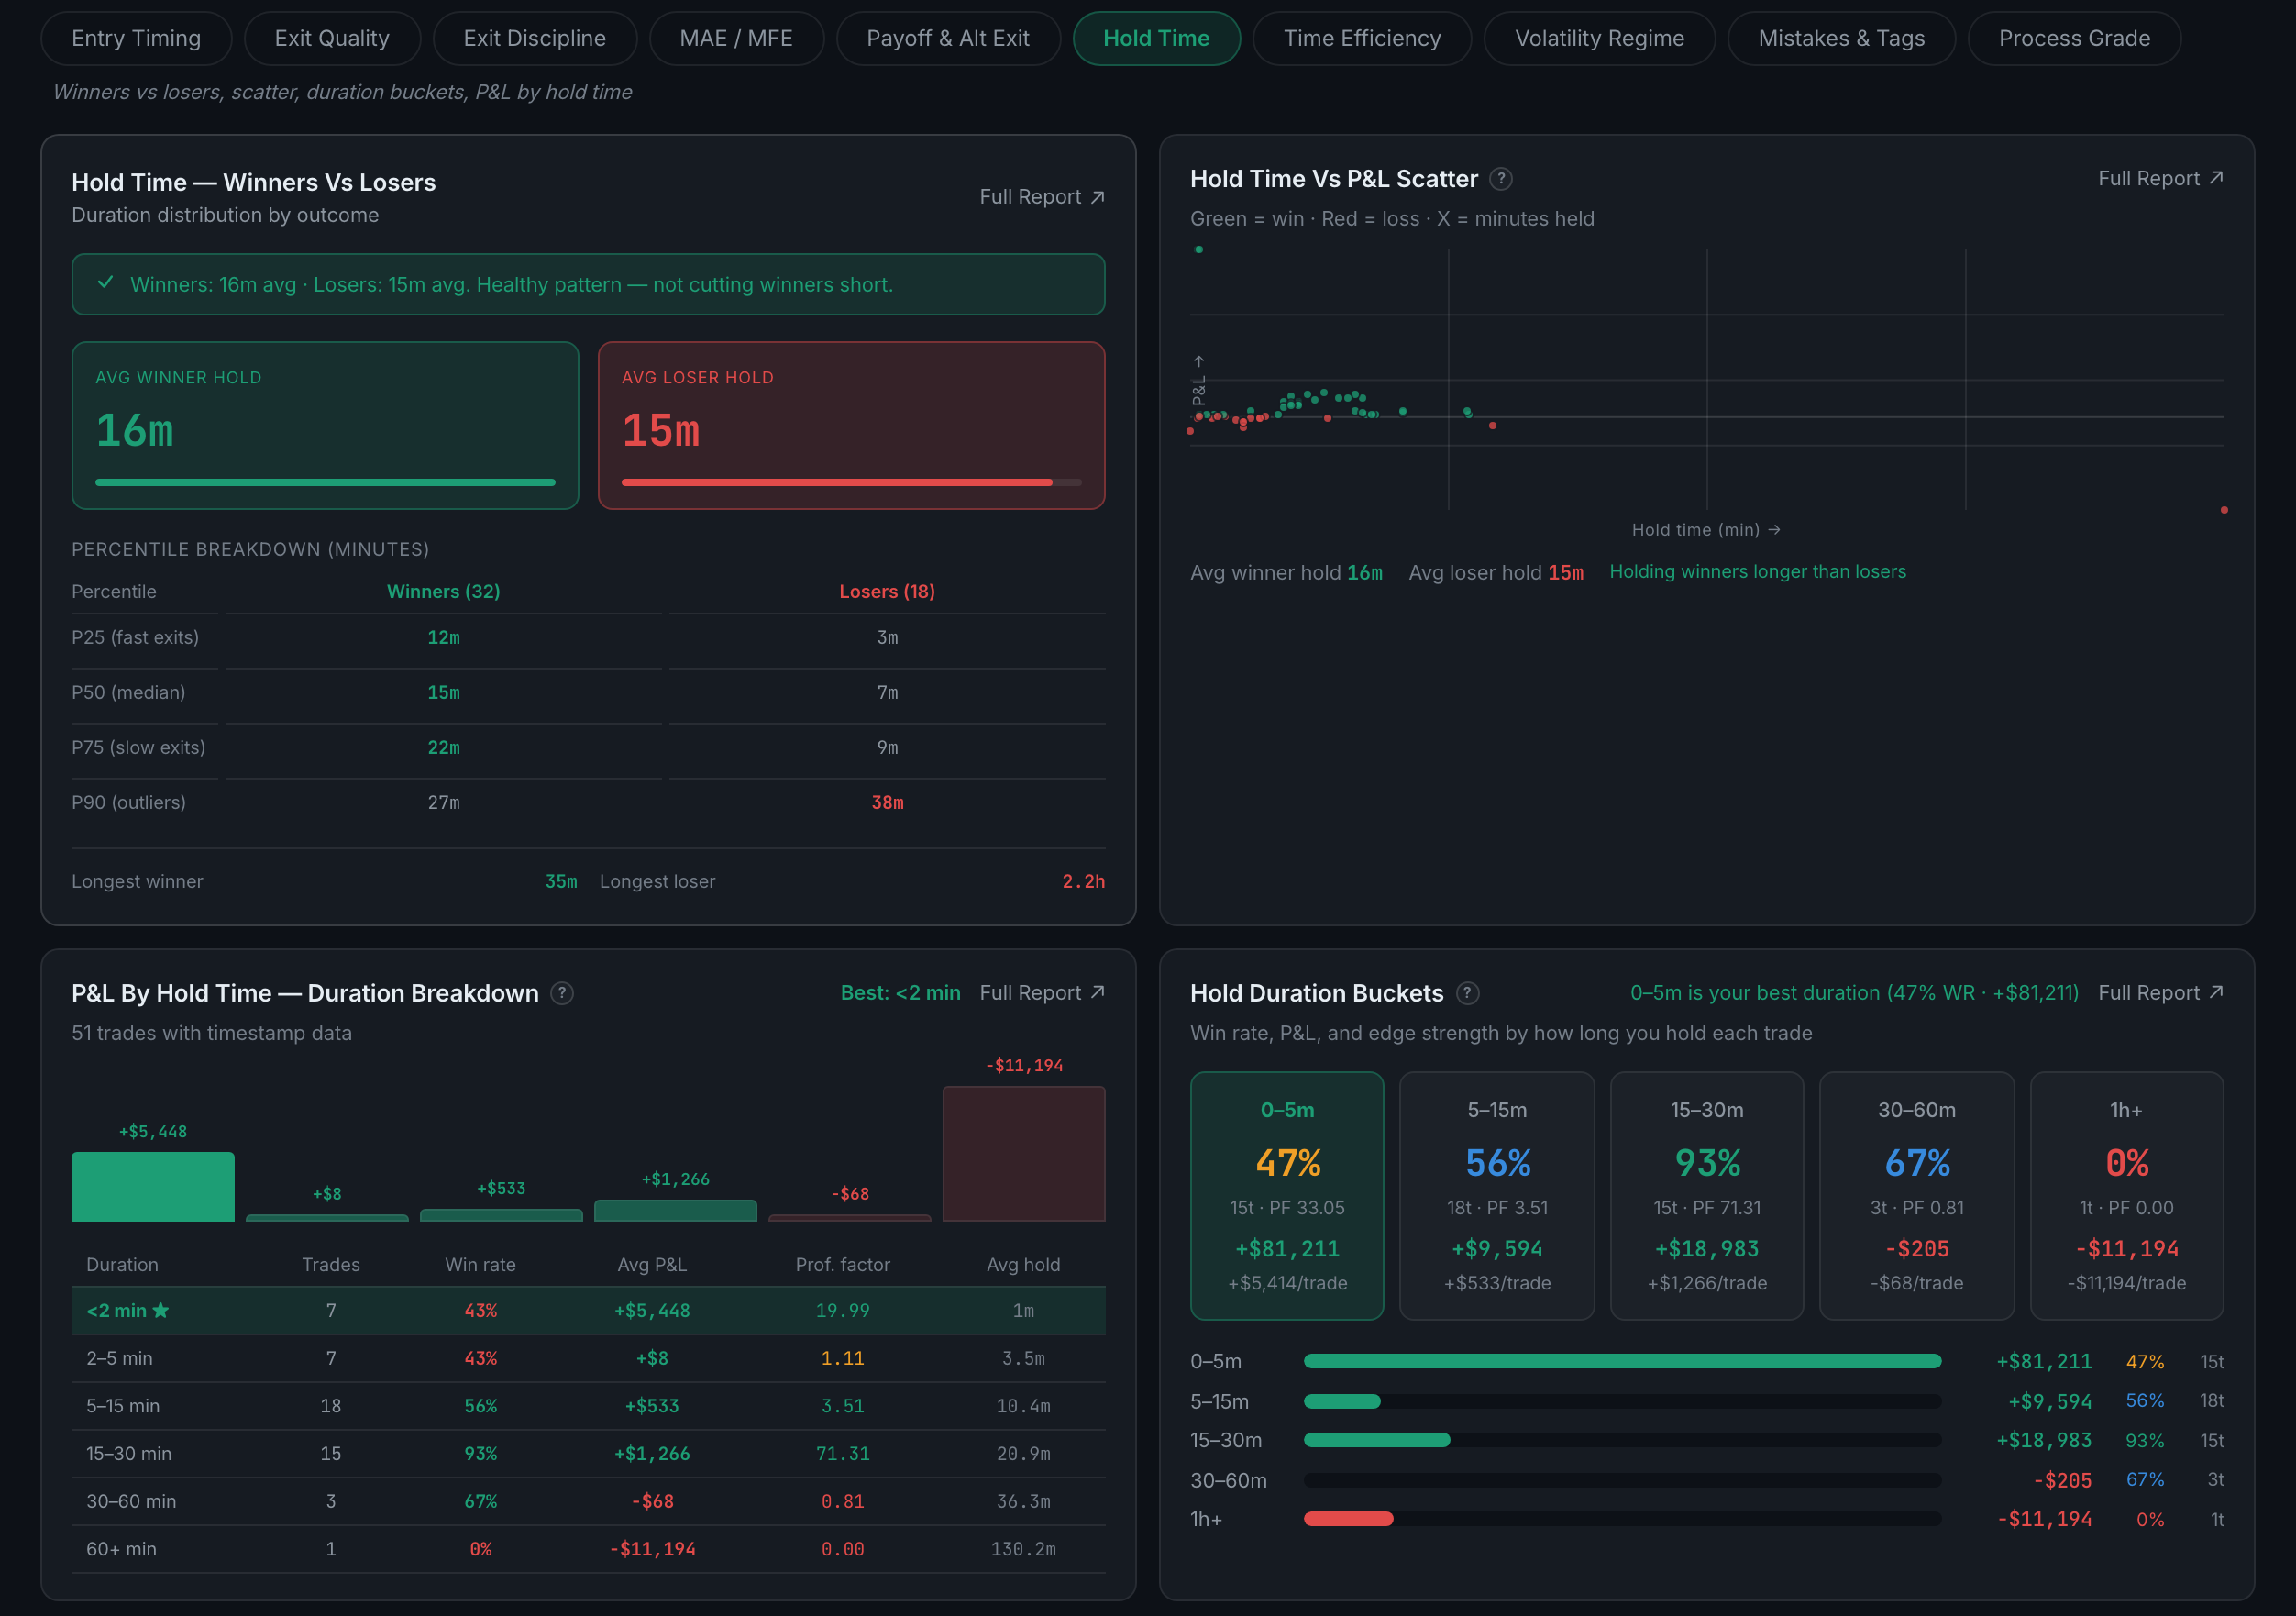
What is on the Hold Time sub-page?
How long you hold, and what it is worth — winners against losers, a scatter, a duration breakdown and bucketed P&L.
Hold time is one of the few execution measures that needs nothing from you but timestamps, and it exposes one of the most common failures in trading almost immediately: the disposition effect, holding losers longer than winners.
Indicators on this sub-page:
- Hold Time — Winners vs LosersAverage duration for each, with a one-line verdict above them ("Healthy pattern — not cutting winners short"), then a percentile breakdown at P25, the median, P75 and P90 for winners and losers side by side, and your longest winner against your longest loser. The percentiles matter more than the averages: one 2.2-hour loser moves an average and shows up honestly as a P90.
- Hold Time vs P&L ScatterEvery trade as a point, duration along the bottom, result up the side, green for wins and red for losses.
- P&L by Hold Time — Duration BreakdownA bar per band and a table under it: trades, win rate, average P&L, profit factor and average hold. Your best band is starred.
- Hold Duration BucketsThe same bands as cards — 0–5m, 5–15m, 15–30m, 30–60m, 1h+ — each with win rate, trade count, profit factor, total P&L and P&L per trade. This is where a band you should stop trading altogether tends to show itself: a 0% win rate on 1h+ is not a nuance, it is a rule.
Note that win rate and P&L can point opposite ways here. A band with the lowest win rate can still be the most profitable, because the winners in it are larger.
Needs entry and exit timestamps on your trades; without both, the whole sub-page is locked.