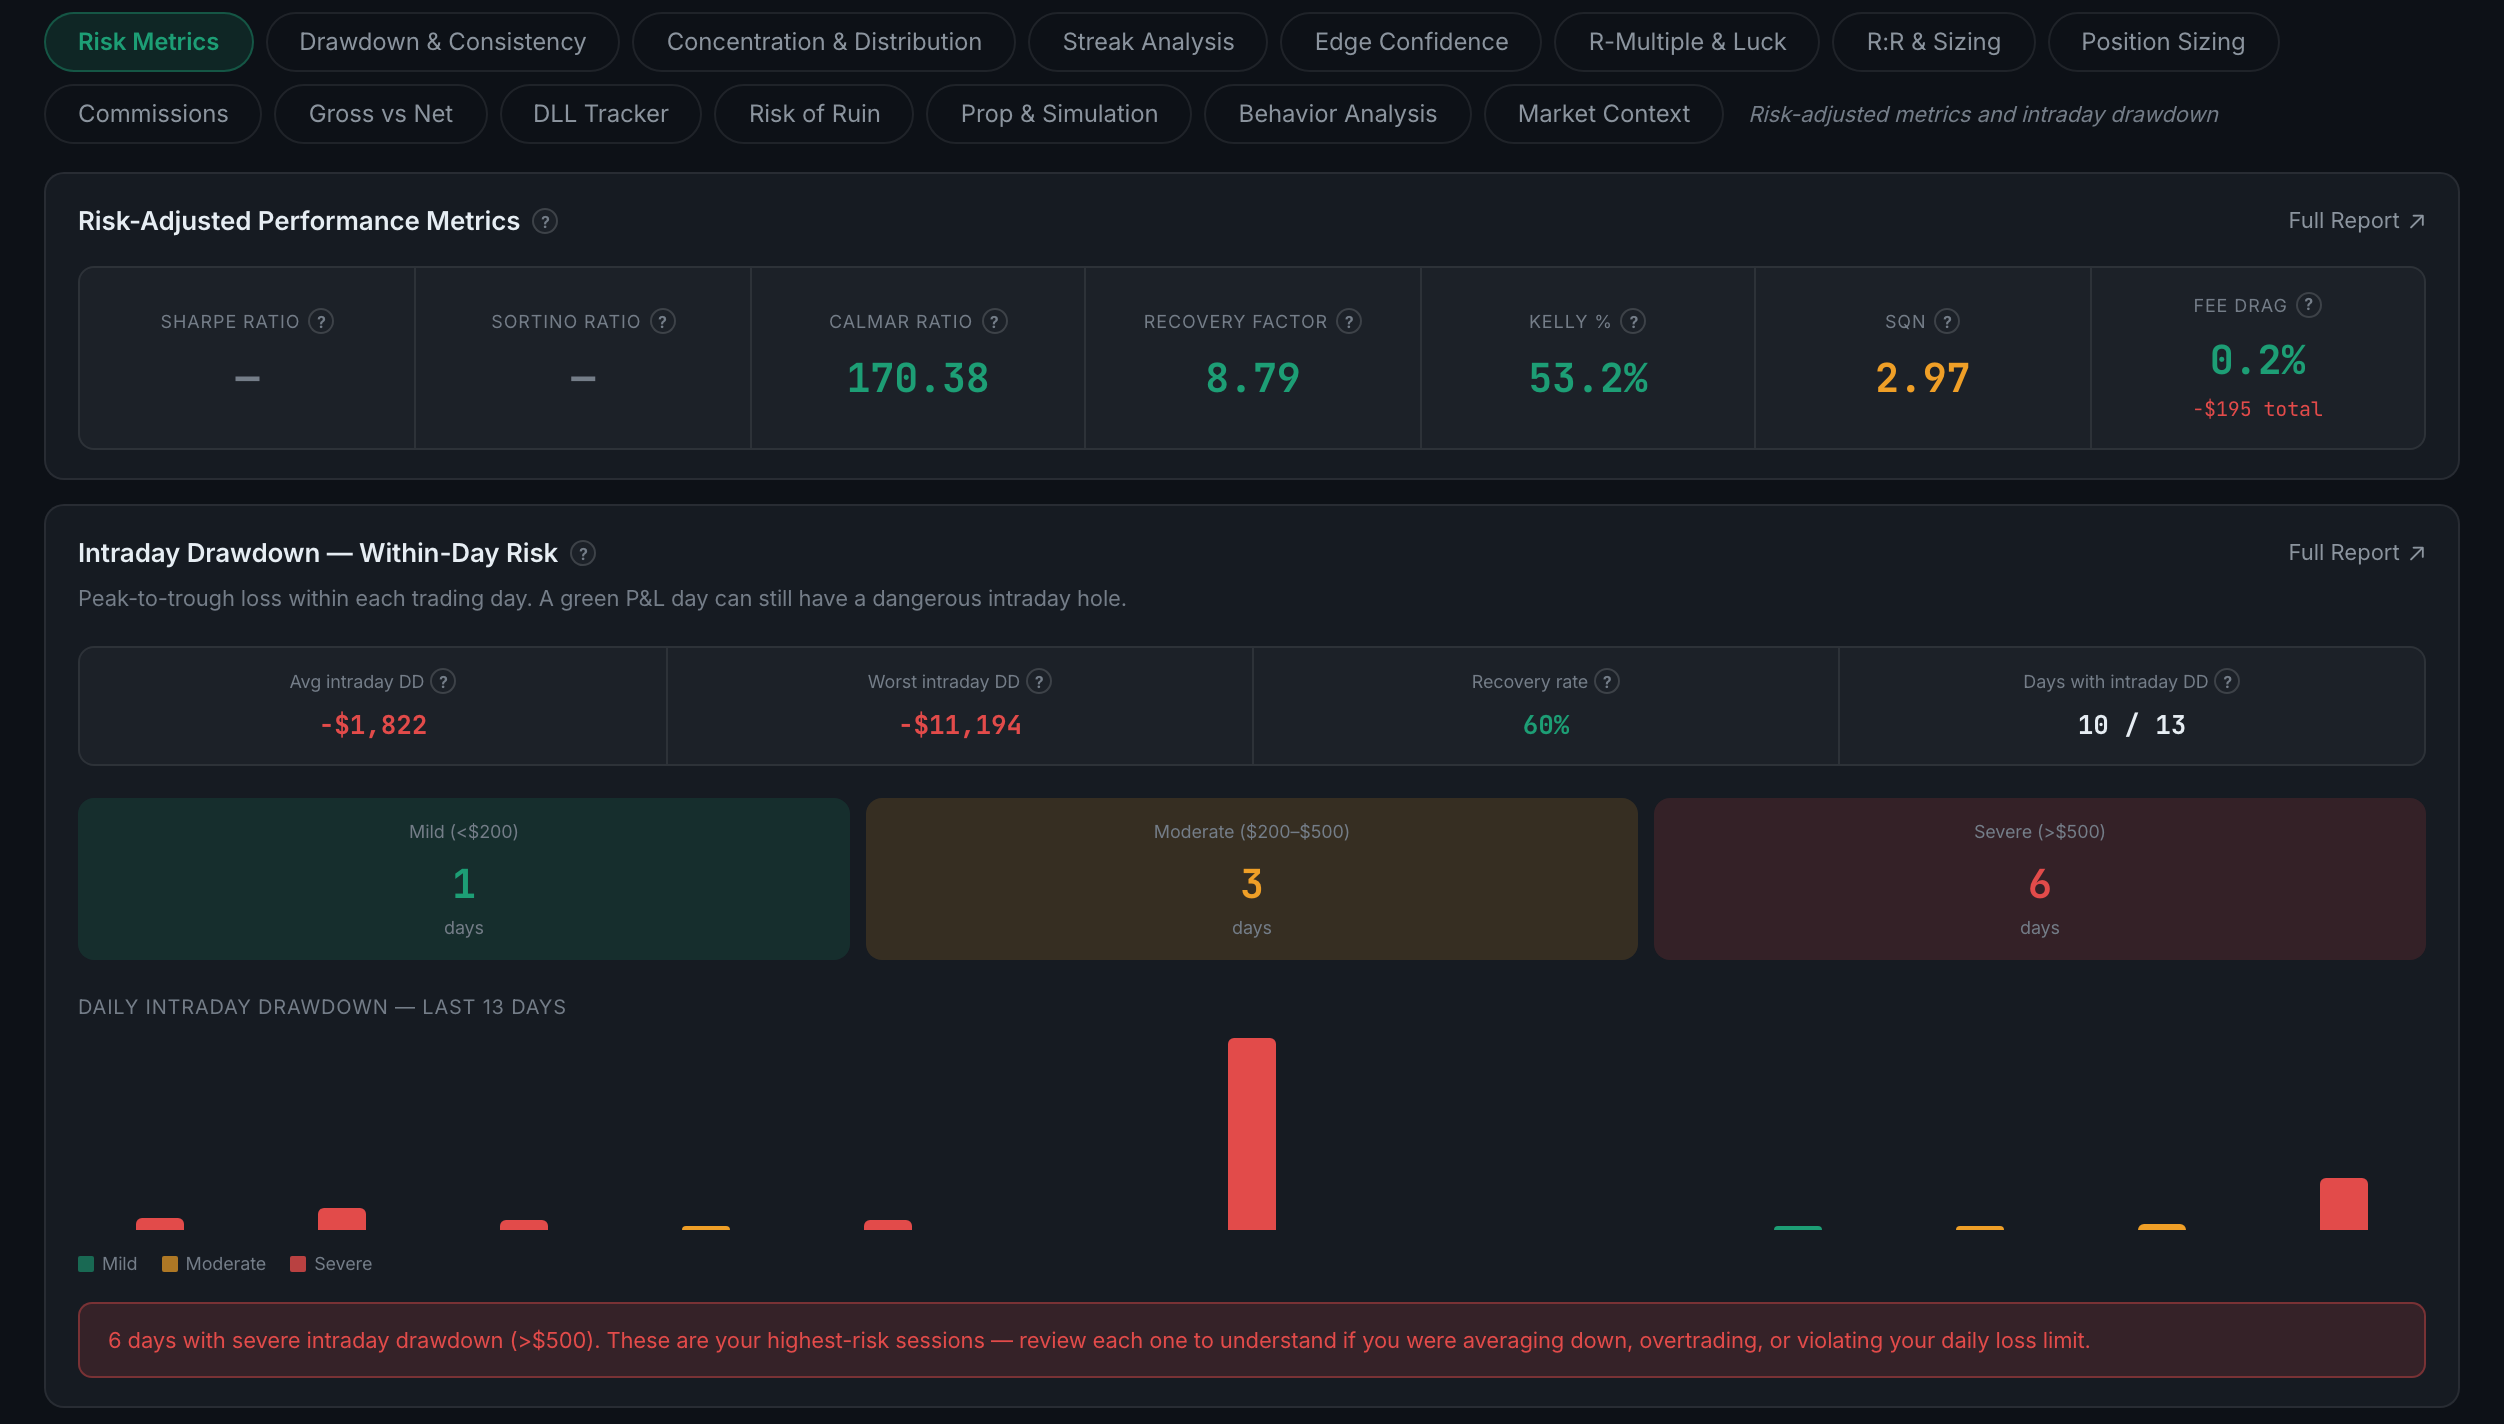
What is the Sharpe ratio here, and why is it sometimes blank?
Your average daily P&L divided by how much it varies, annualised. It stays blank until you have 20 trading days, on purpose.
Sharpe answers "how much bumpiness am I accepting for this return". A high number means a steady climb; a low one means the same result arrived through wild swings.
It is computed from daily P&L — every trading day totalled, then the average divided by the standard deviation, multiplied by the square root of 252 to put it on an annual footing.
That annualisation is exactly why it is withheld early. Multiplying by √252 when you have six days produces a double-digit Sharpe that the benchmark table beside it would then grade as excellent. Rather than print a flattering number, the app shows a dash until there are 20 trading days behind it — so a blank Sharpe on a new account is the guard working, not a fault.
Higher is smoother. The app colours it against a benchmark table shown beside it; read the direction rather than the decimal, because a Sharpe computed on twenty days is still a small sample wearing an annual figure.
The same guard applies to the smoothness score built alongside it. When a component cannot be computed its weight is spread across the others, rather than counted as zero — a clean equity curve should not score badly for want of sample size.