What is confluence?
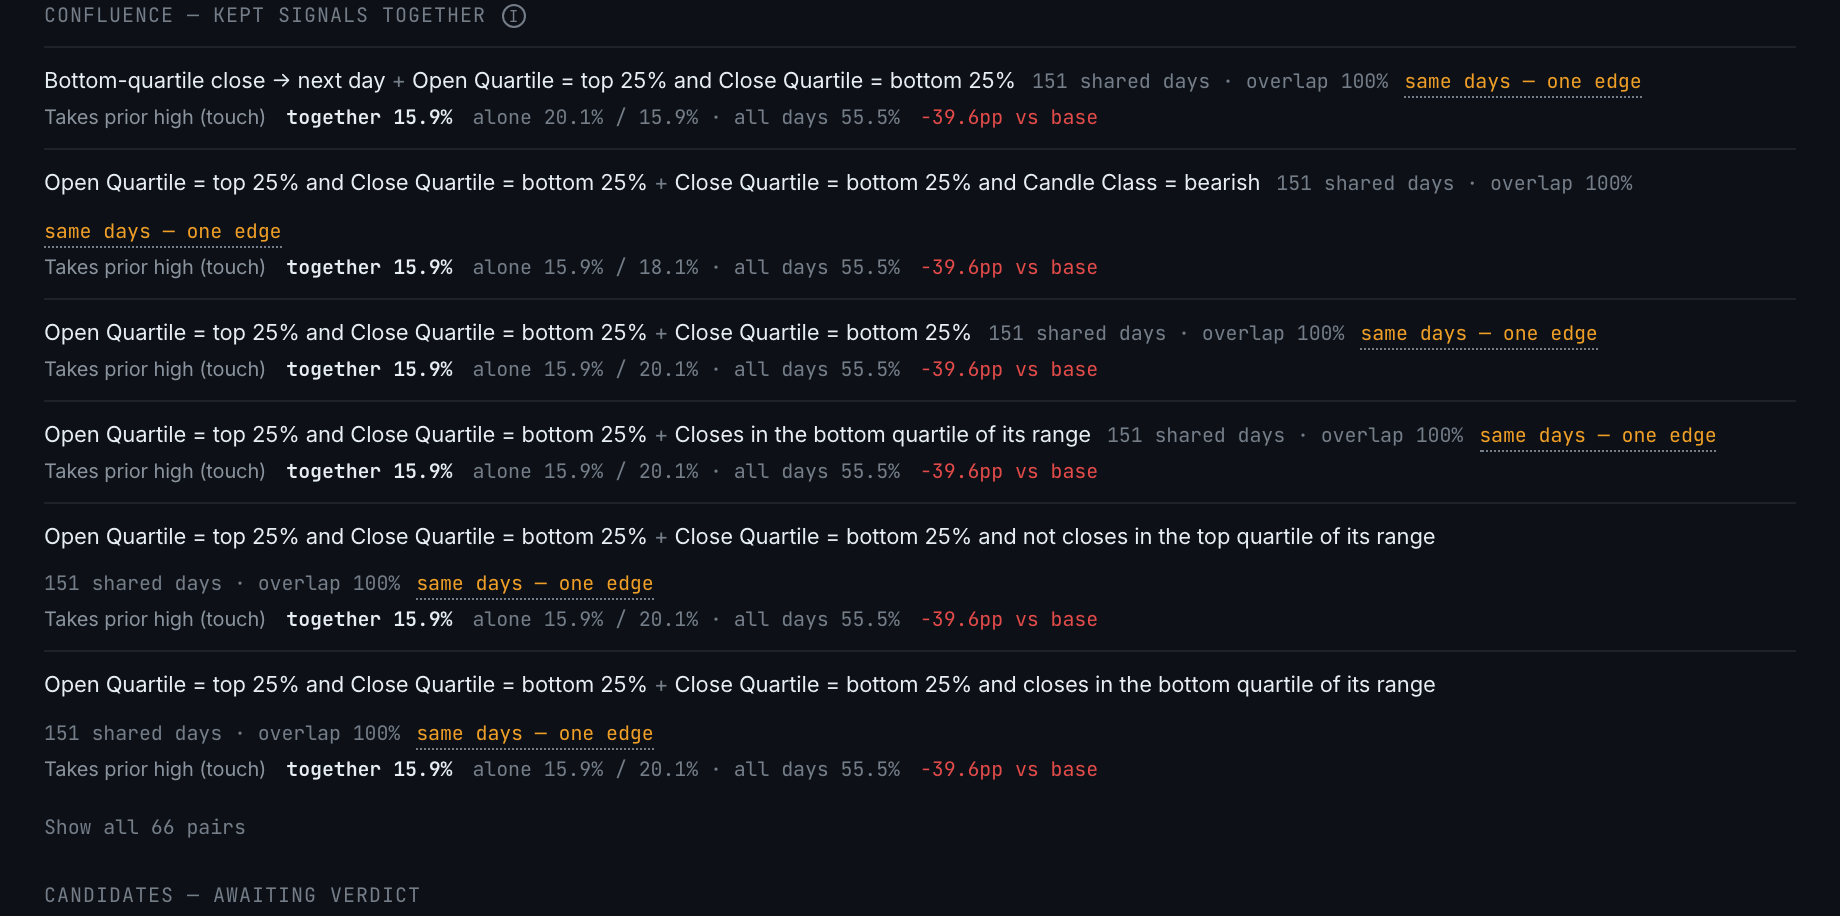
Every pair of kept signals read against each other — how often they fire on the same days, and what happened on the days they agreed.
The Confluence section appears under the kept exhibits once a dataset has two kept event studies. It exists to answer two questions a report of separate exhibits cannot.
The first is are these actually two ideas? Two conditions that fire on 70% or more of the same days get flagged in amber as same days — one edge. This is the finding that matters most and is hardest to see any other way: two studies with different names, both graded A, both looking like independent confirmation — and they are one idea wearing two hats. Trading both at full size doubles your position on a single bet.
The second is is the pair better than either one alone? For each outcome the row shows the rate on days both fired, the rate for each one alone, the all-days baseline, and the gap. All the rates in a row share one denominator rule, so the columns compare honestly.
A pair with fewer than 10 shared days is not measured. The row says so and gives the overlap count instead, because at that size the overlap is the finding.