What is the Stats page for?
Defining datasets about the market, logging observations into them, and getting a report on what those observations turned out to say.

The research desk. Everywhere else in the app the subject is your trading; here the subject is the market. You define a dataset, the app fills in what it can compute and you log the rest, and then it measures what you collected — how often a condition is followed by a particular outcome, and how often that outcome happens anyway.
Stats is the one area that is not about your trades.
The Journal records what you did. Analytics reads that record back to you. Stats sits outside both: it is a place to ask questions about the market itself — does a session that closes in the top quarter of its range get followed by a higher high tomorrow, does the week's high land on a Tuesday more often than chance would put it there — and to answer them from data rather than memory.
The shape of the page follows from that. There is no dashboard of your own metrics here. There is a list of datasets, and opening one opens a report on what that dataset has been able to prove.
No questions on this page match that. Search all 15 areas
Defining datasets about the market, logging observations into them, and getting a report on what those observations turned out to say.
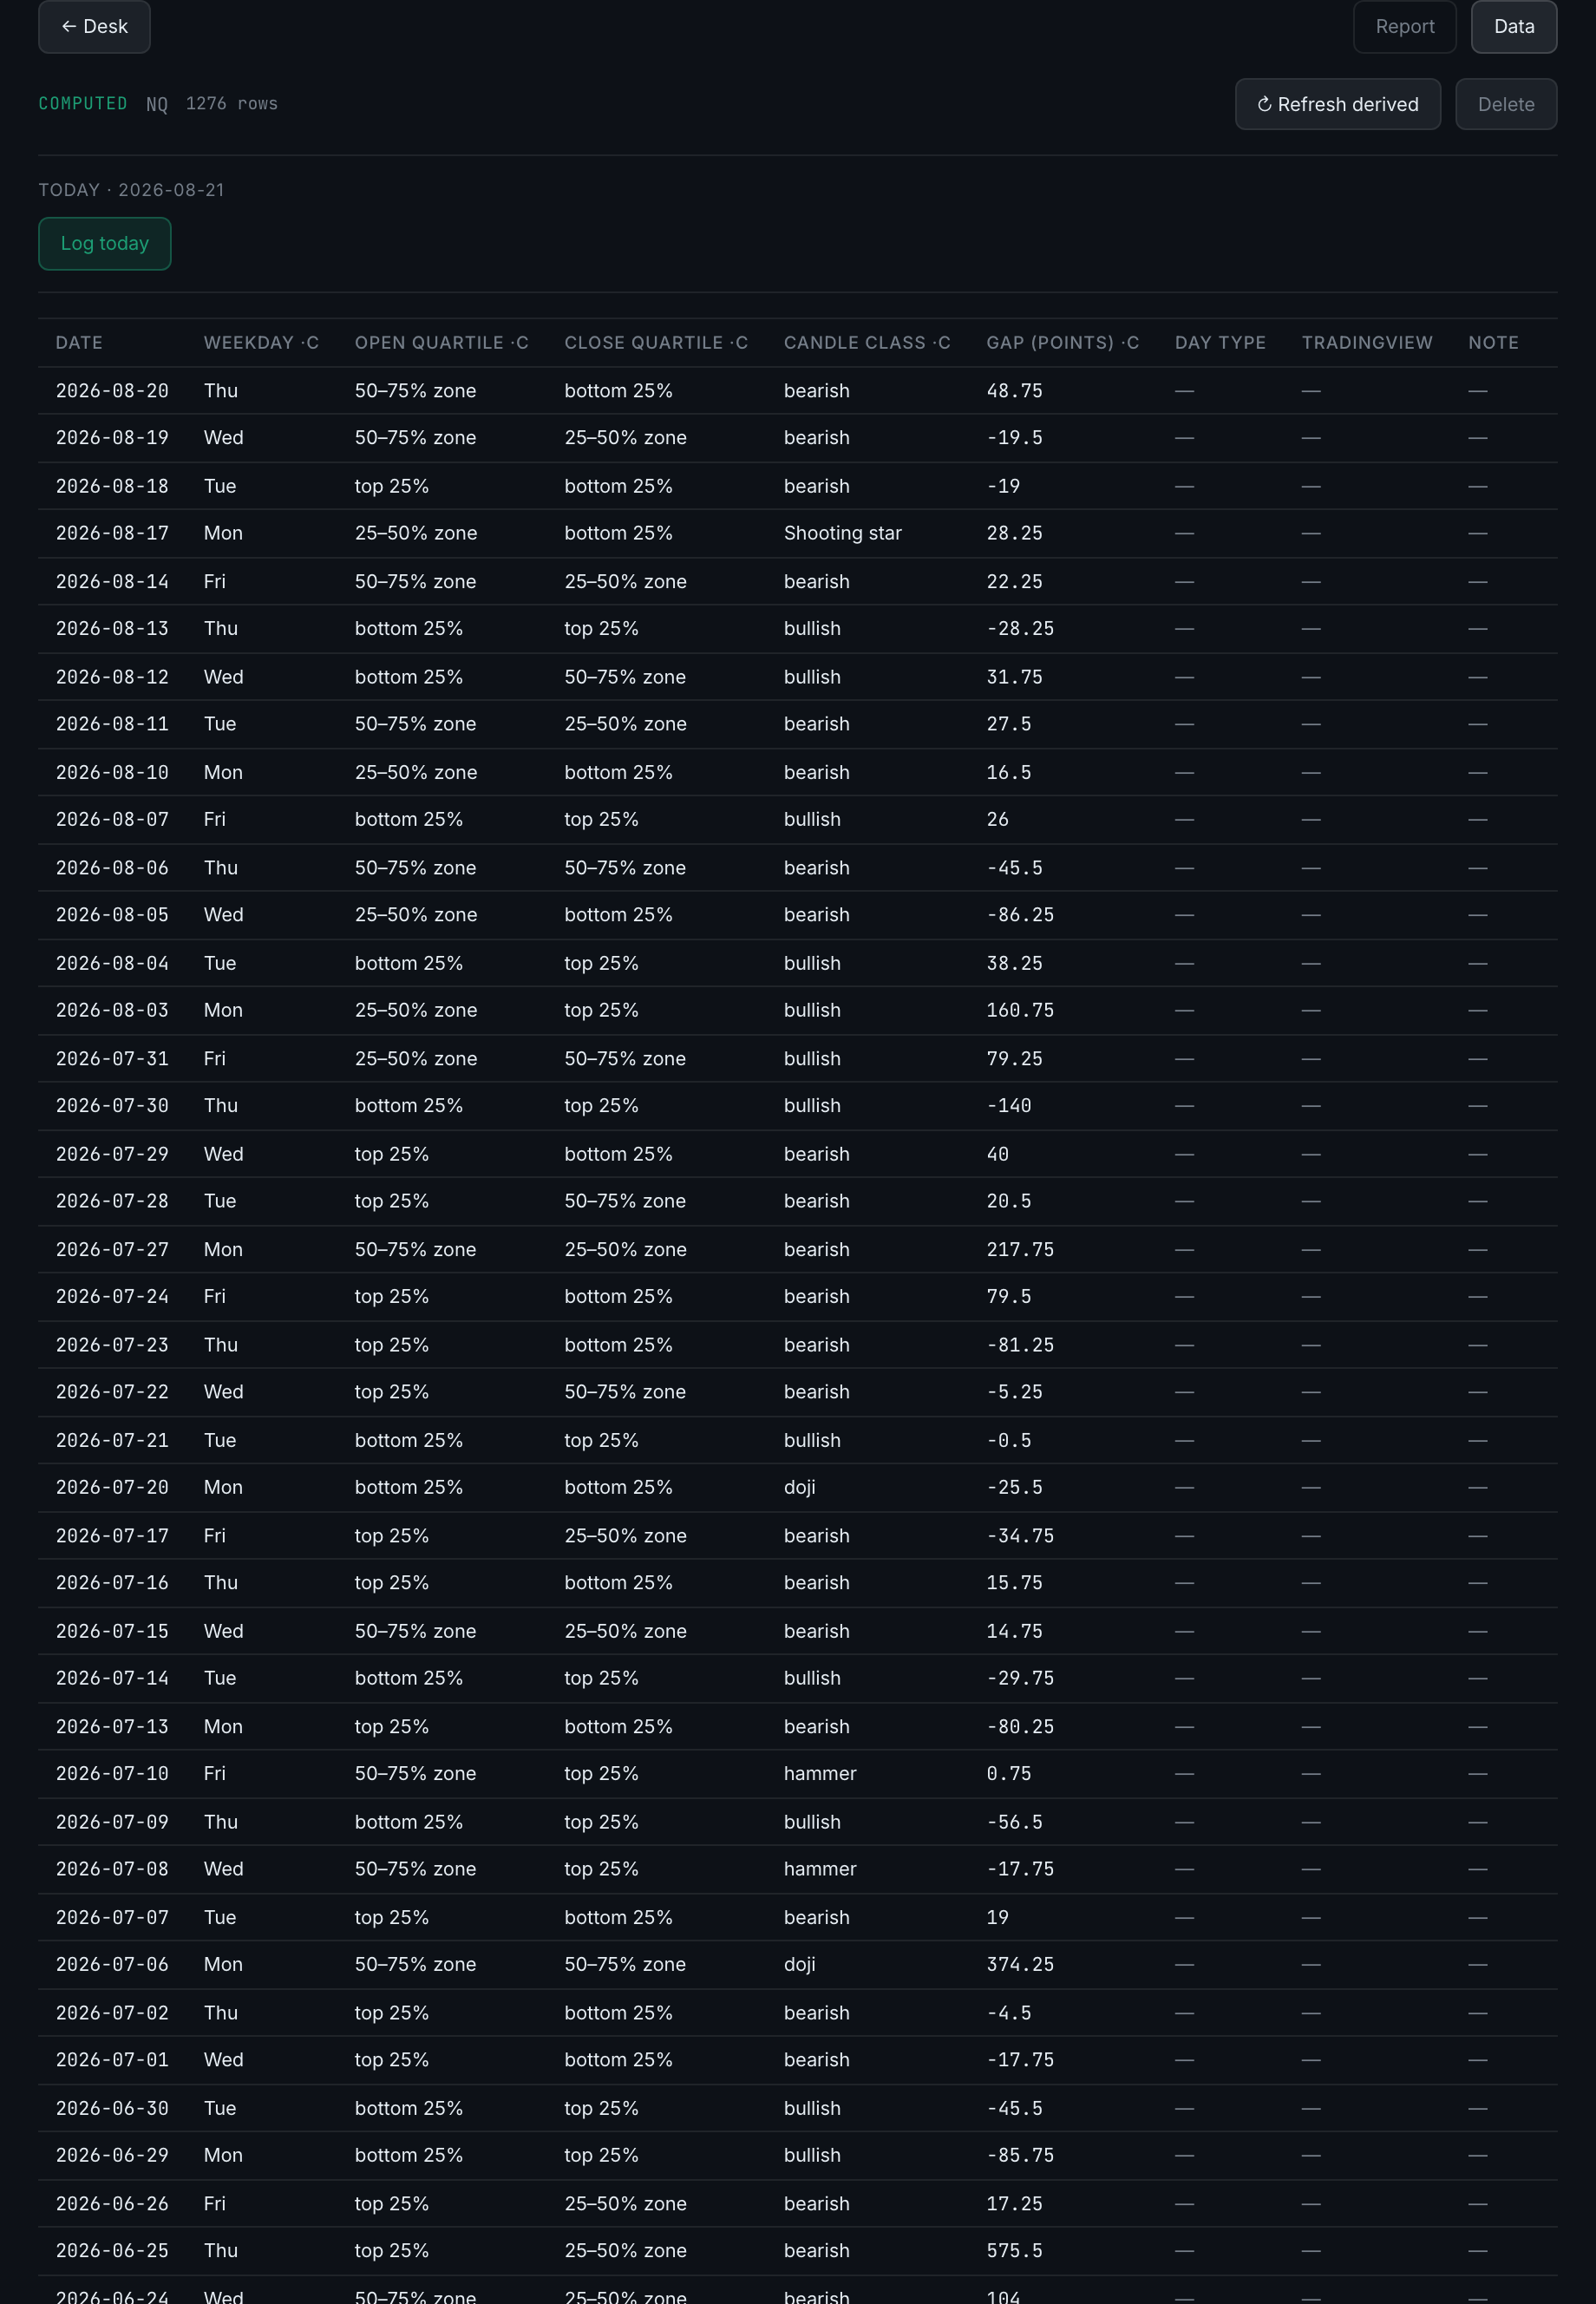
A table with one row per day and one column per thing you are tracking. Columns are either computed from daily bars or filled in by you.
Read the full guideA computed column is worked out from the instrument's daily bars, for every day, automatically. A manual column is one you type into.
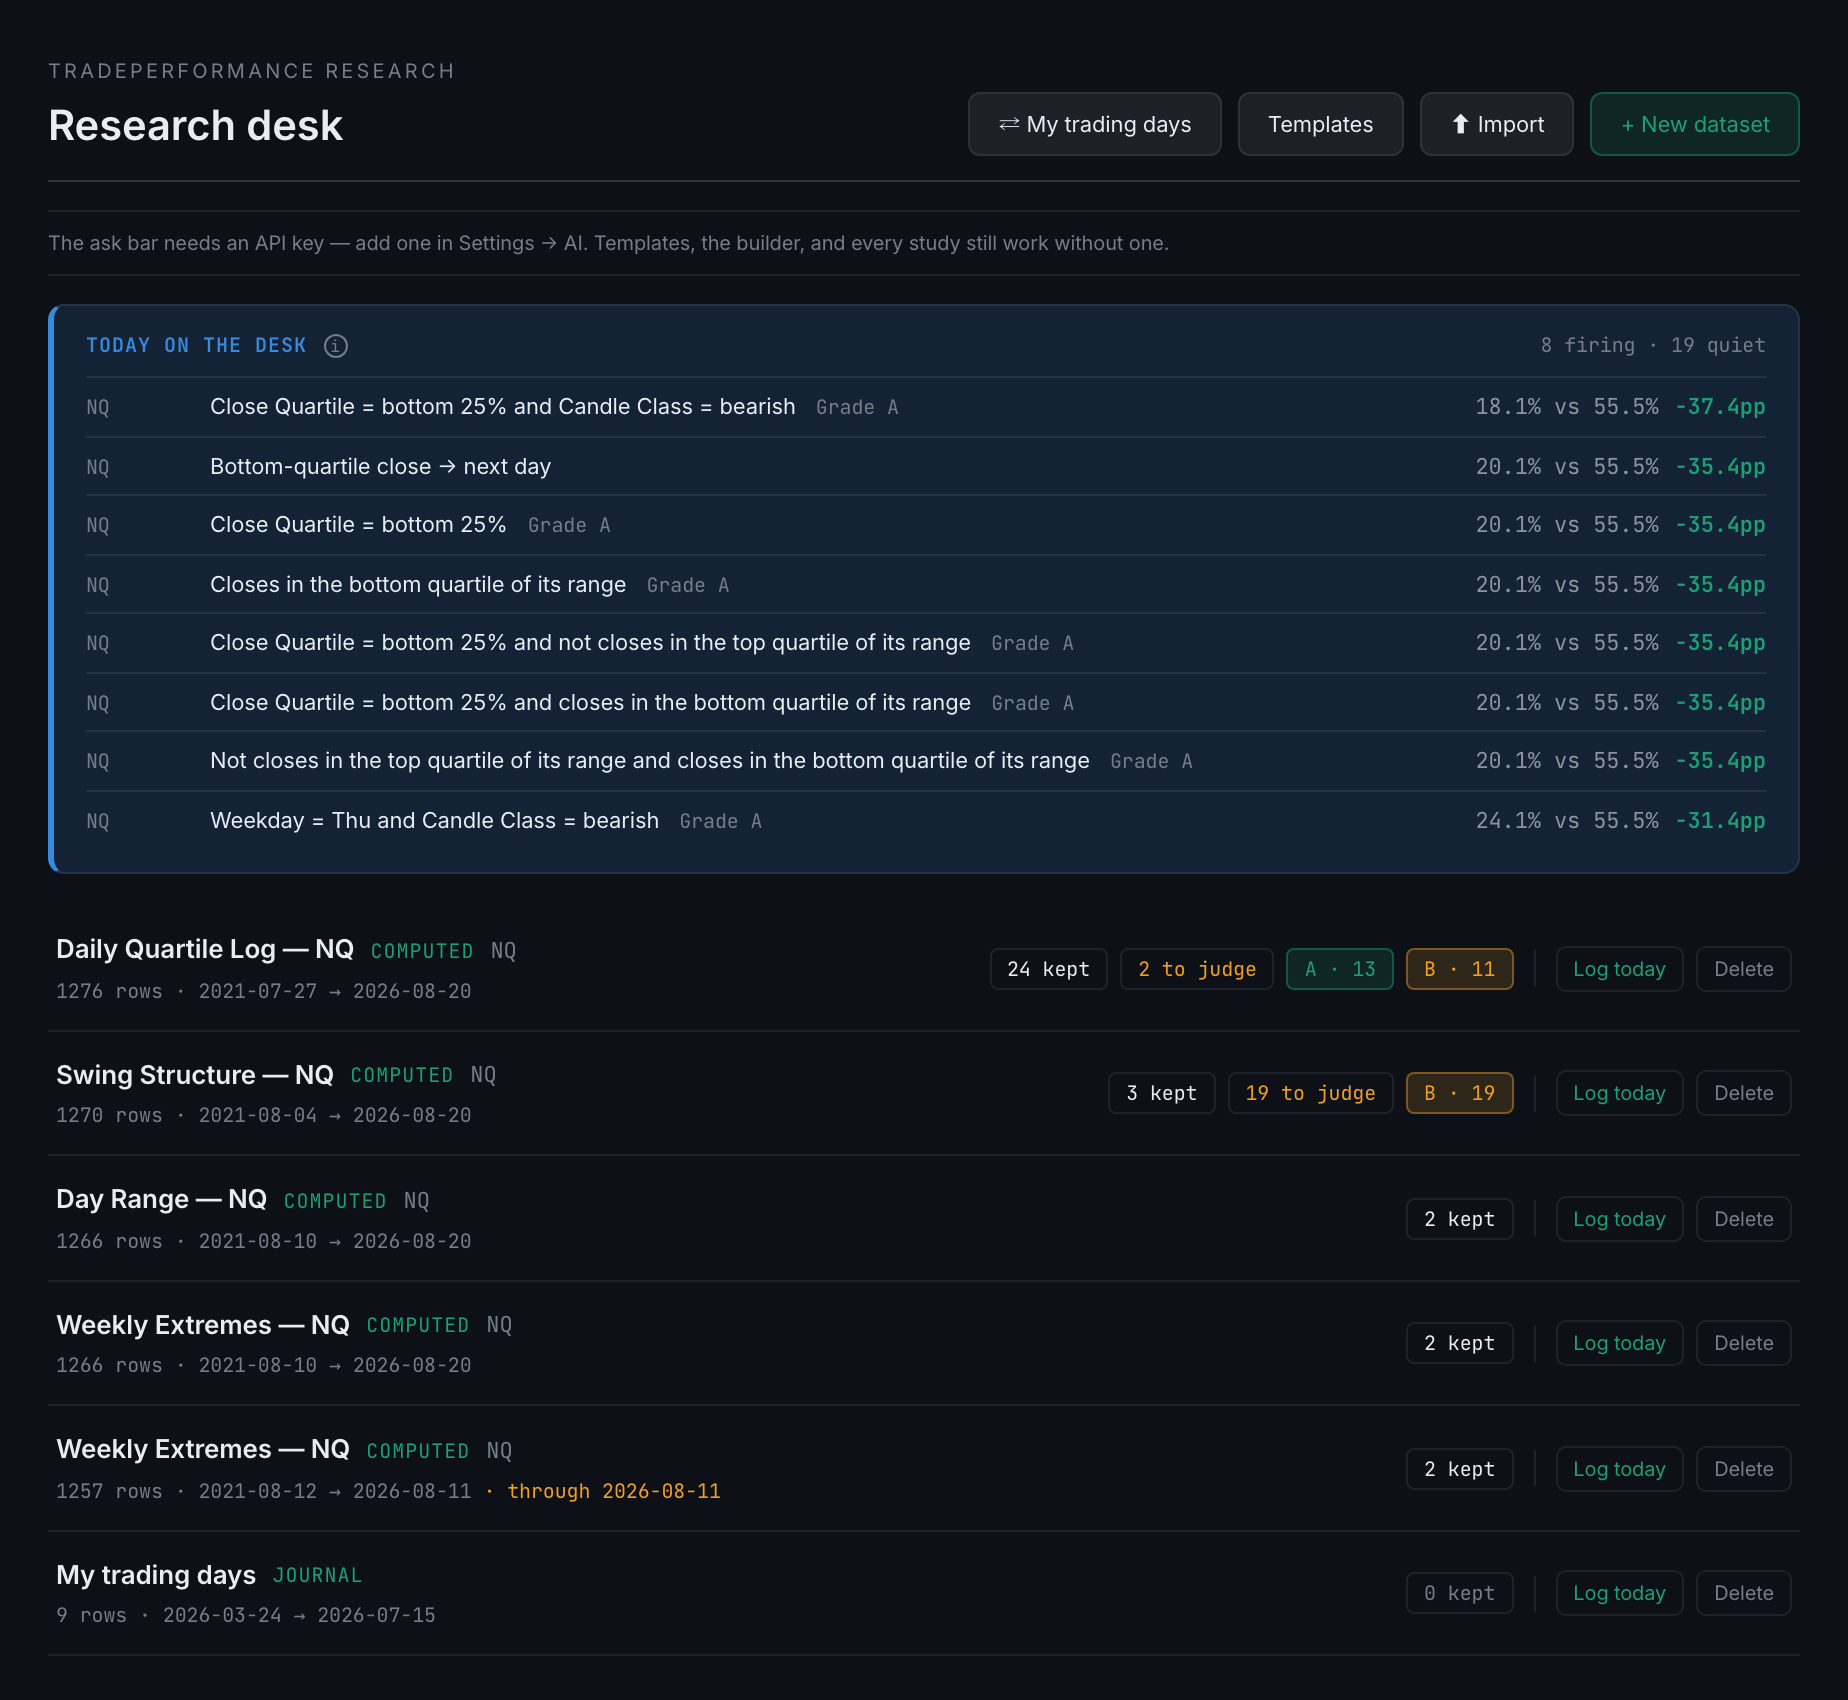
Read the full guideThe dataset's name, where its data comes from, how many rows it holds and over what dates, and a cluster of pills counting the studies it has produced.

A dataset built from your own journal — one row per day you traded — so your trading can be studied with the same machinery as the market.

Thirteen ready-made datasets. Most need nothing but a ticker, and several need no logging at all — they compute everything and ship with studies already built.

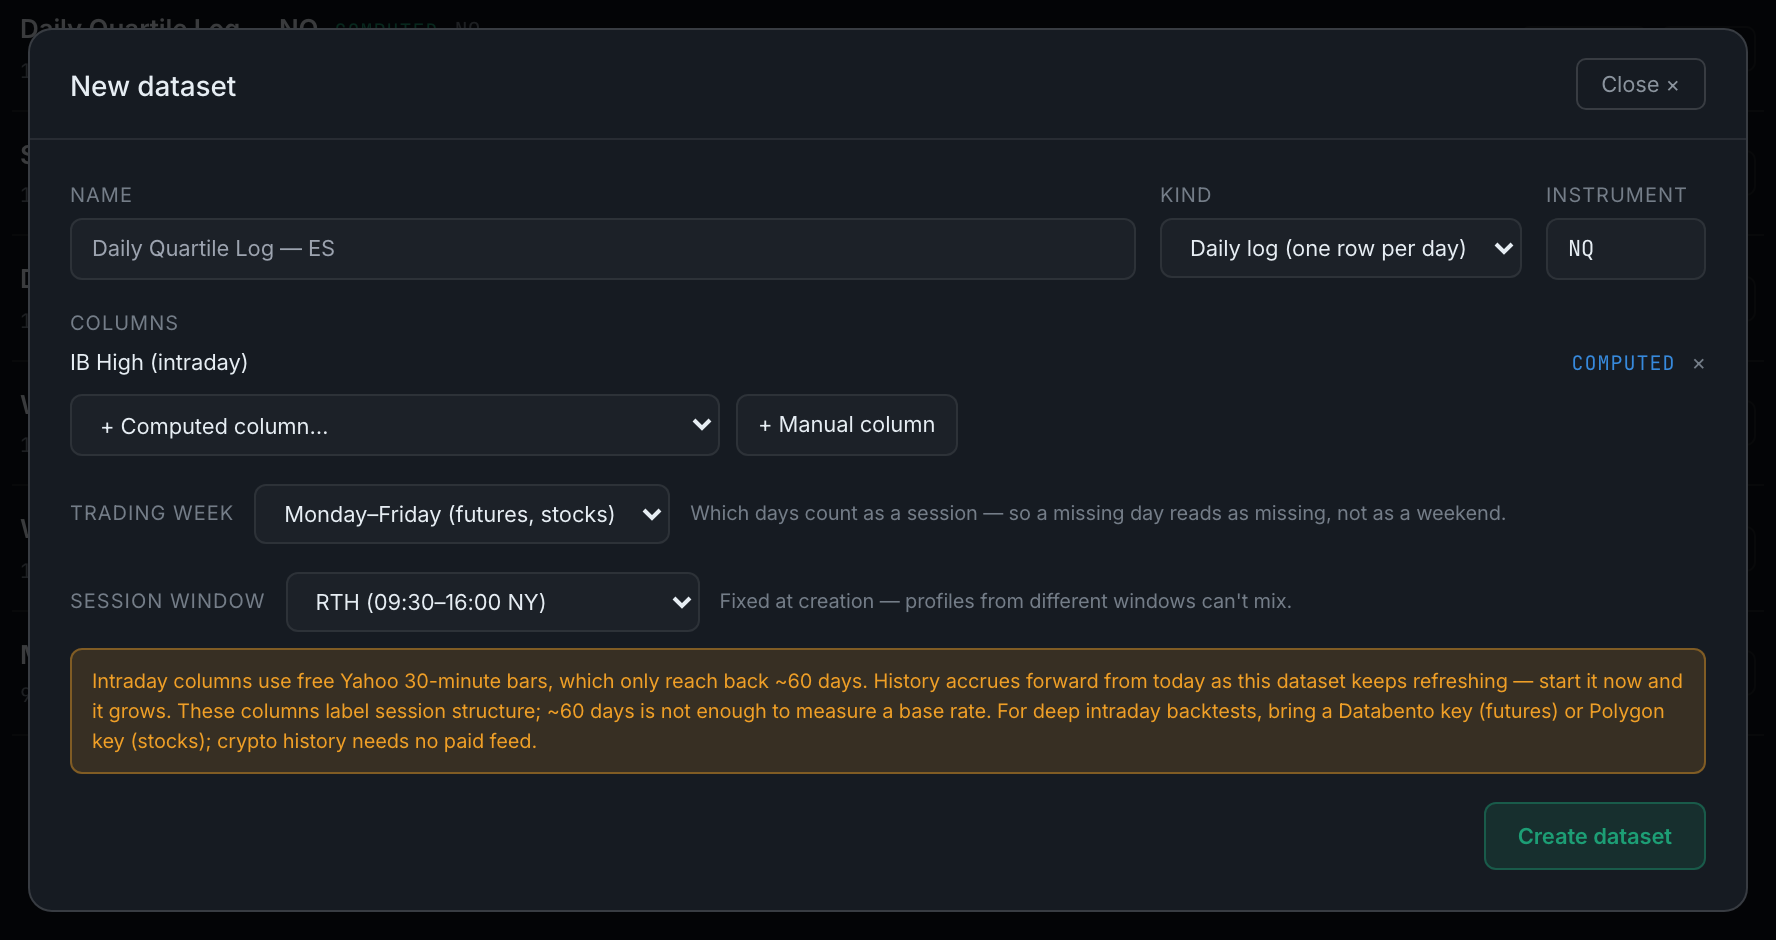
+ New dataset, give it a name, pick daily log or event log, set the instrument, then add columns — computed ones from the dropdown, manual ones you define yourself.

Two statements about the instrument that stop the app misreading its own data. Trading week says which days count as a session; session window says which hours an intraday column should measure.
Yes — ⬆ Import takes .xlsx, .xls or .csv, lets you set each column's type, and needs you to nominate one column as the date.

Creates today's row and takes you to it, so you can type in the columns the app cannot work out for itself.

The dataset itself — every row, newest first, with every column. Click a row to edit its cells.
You typed that value in, and it overrides whatever the app computed for that cell.
Read the full guideEverything the dataset has been able to prove, laid out as a numbered set of exhibits — one per study you have kept.

A study is one question measured against a baseline. Kept means it is in the report; candidate means the scan filed it and you have not judged it; discarded means you took it out.
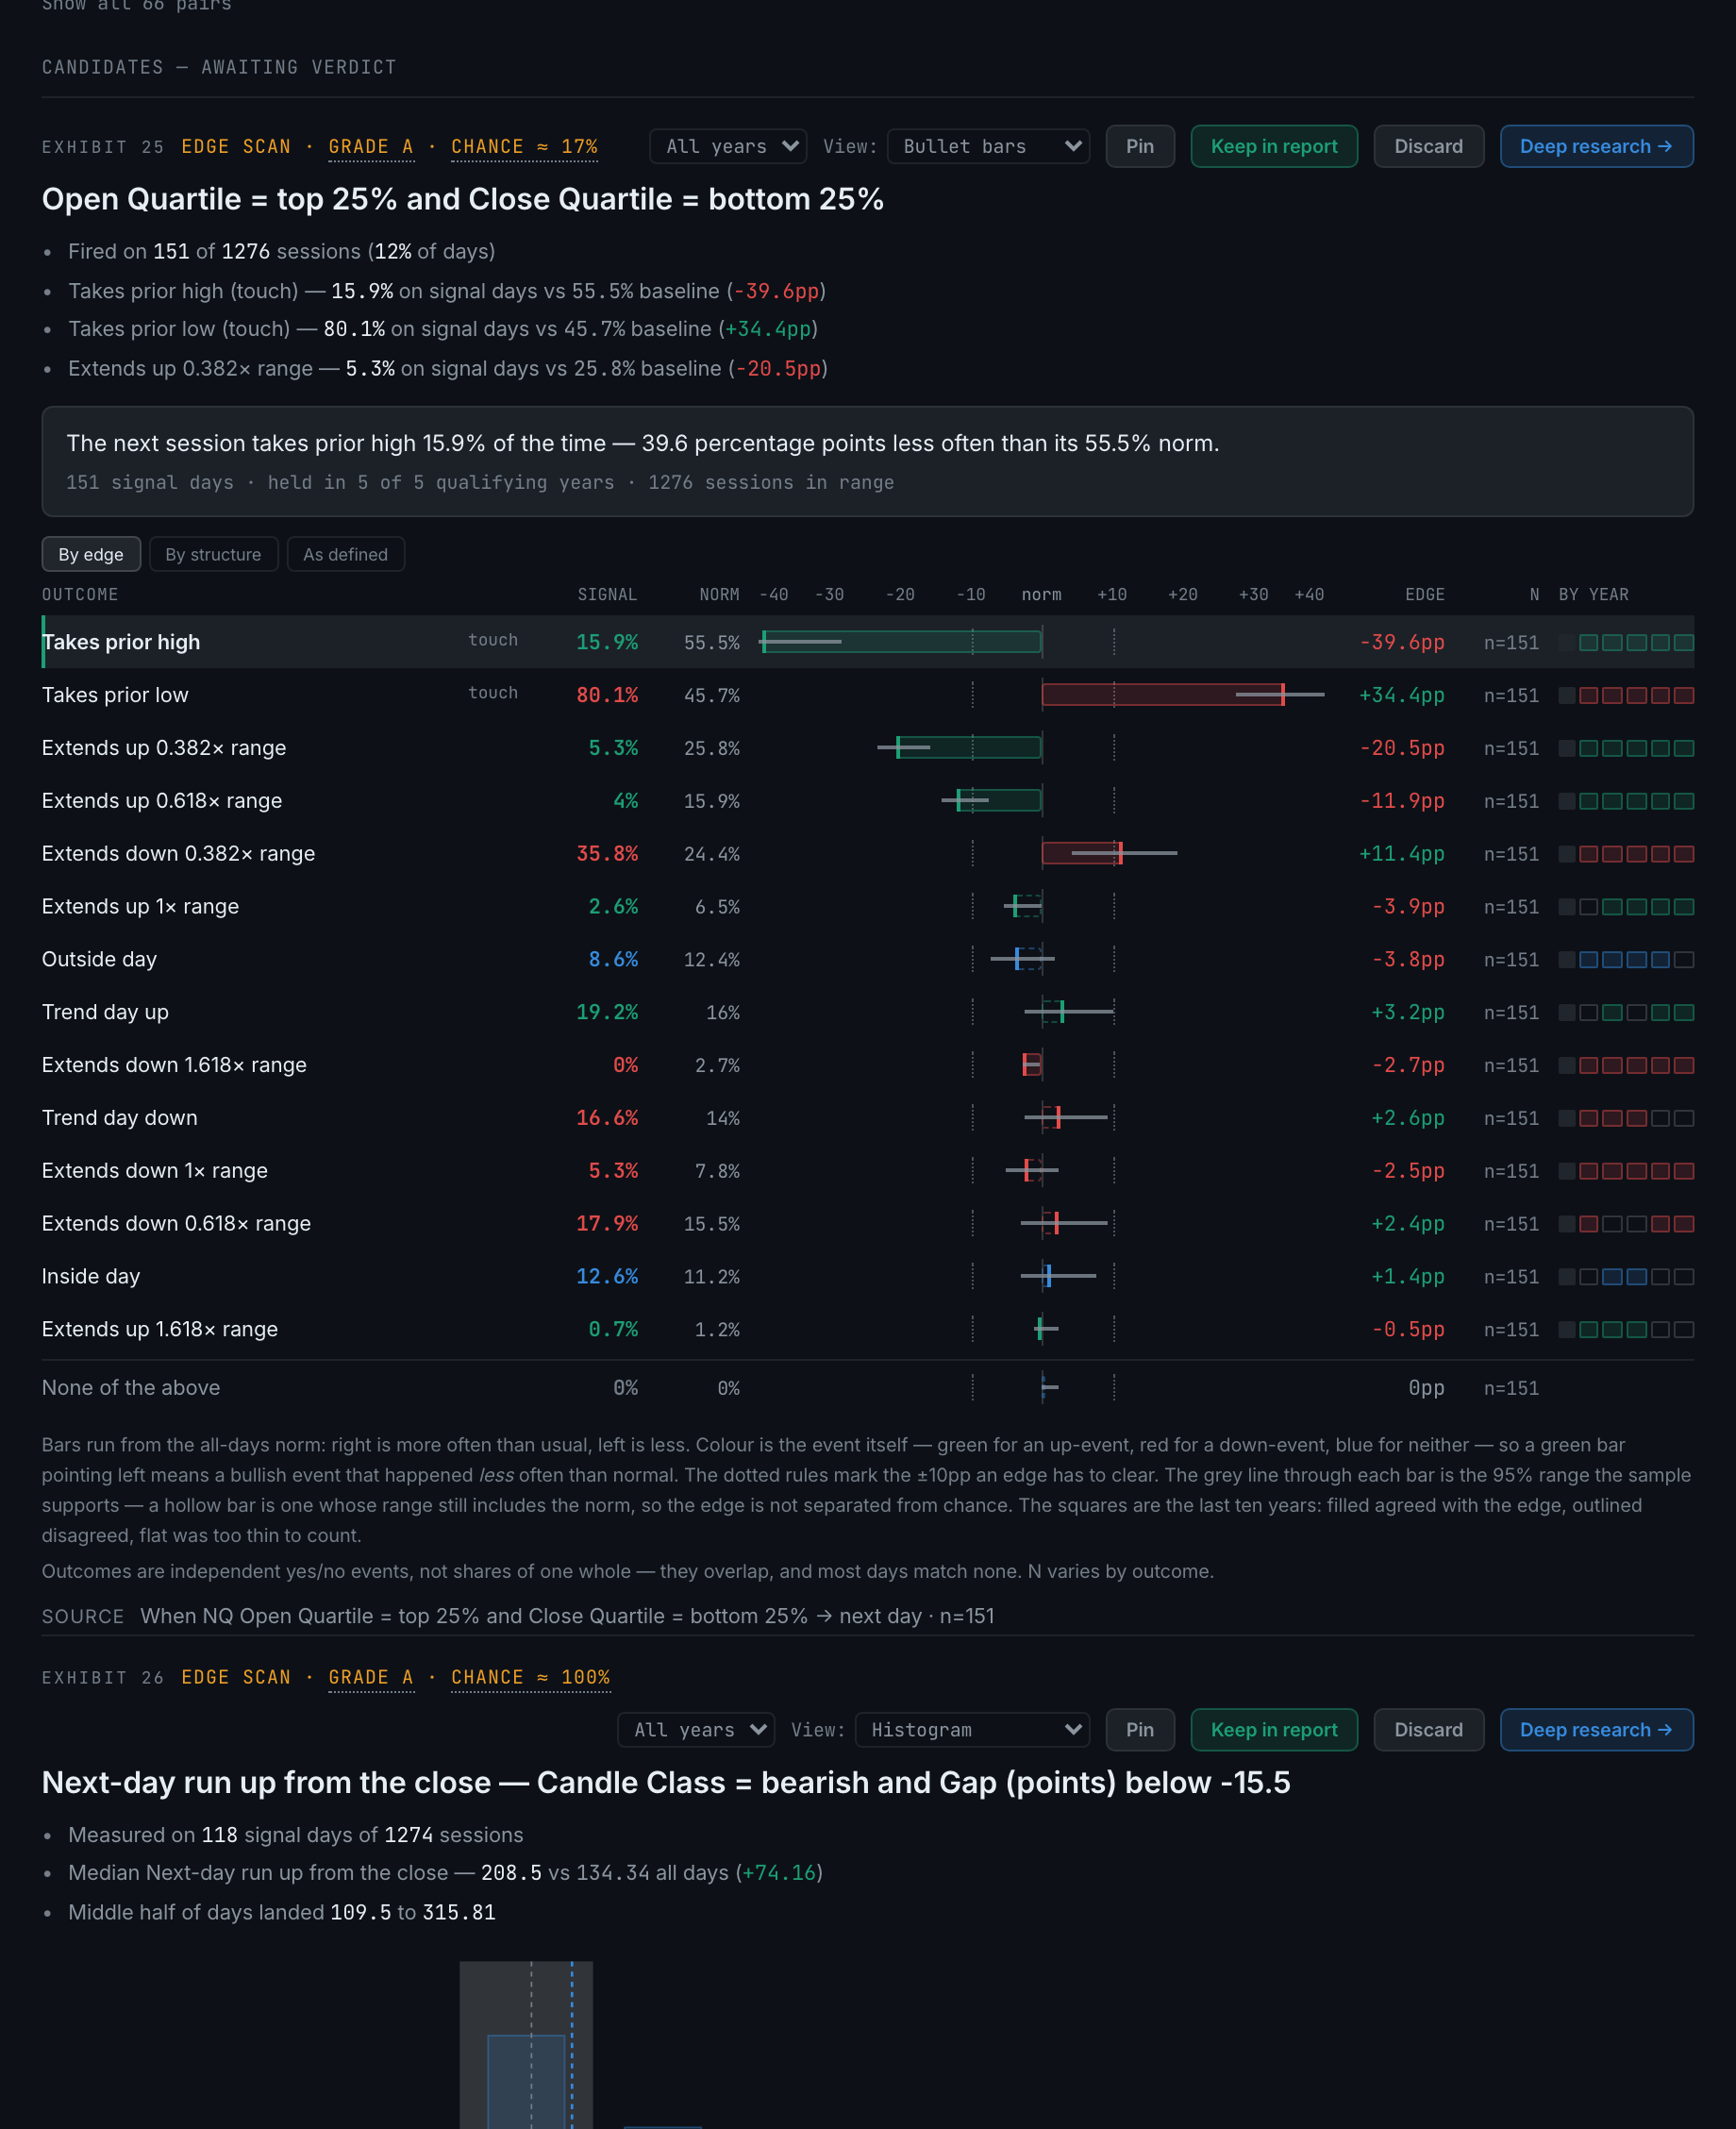
It tries every condition the dataset can express against every outcome in its library, and files the combinations that clear a fixed set of guards.

How many of the five guards a study cleared. A cleared them all with room to spare, B cleared them all at the minimums, C failed exactly one. Two failures gets no grade at all.
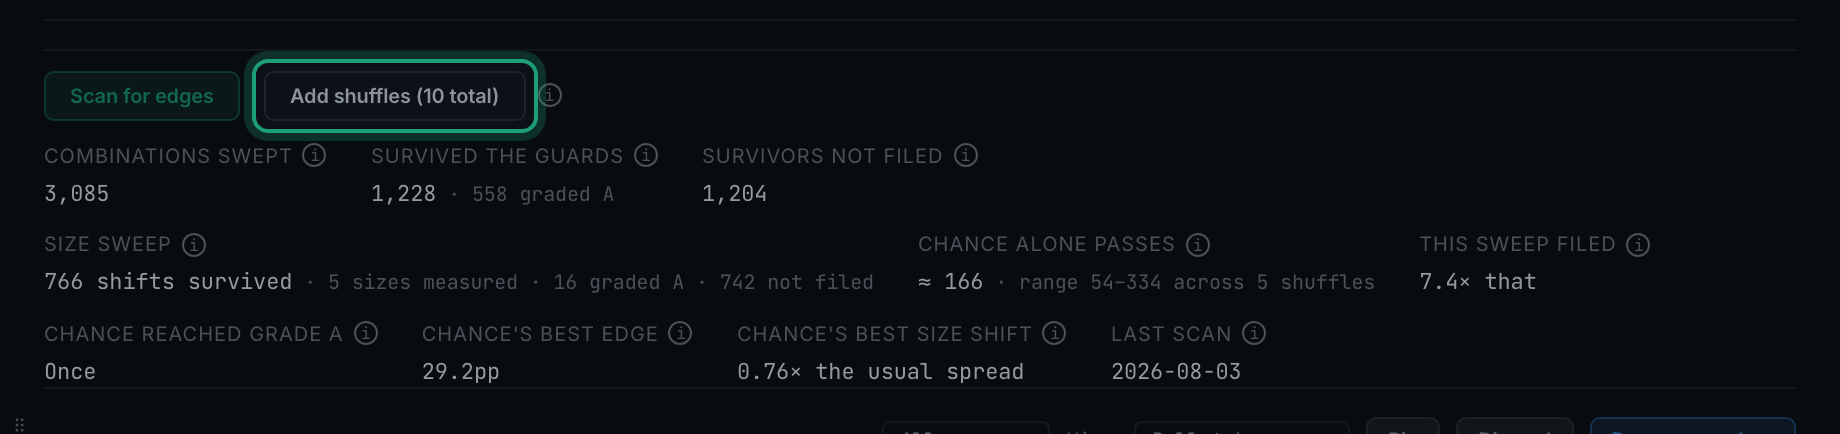
Read the full guideIt shuffles the outcomes — breaking any real link to the conditions — and re-runs the whole sweep. Whatever still passes is what pure luck can do on your data.
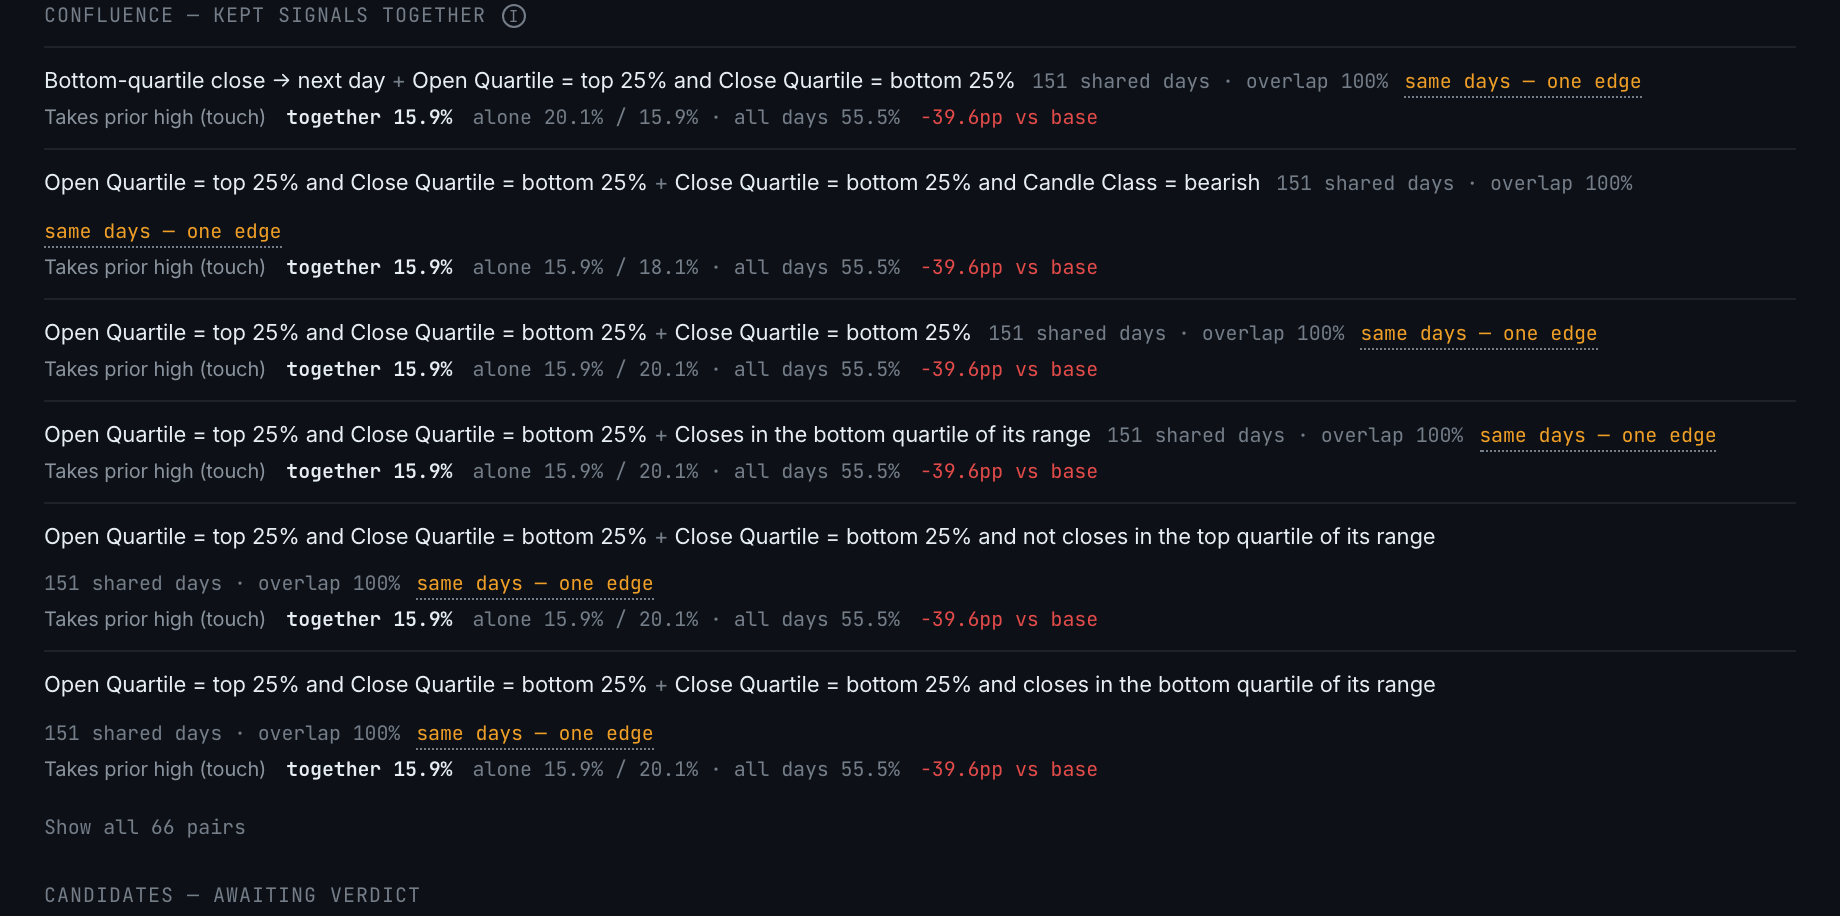
Every pair of kept signals read against each other — how often they fire on the same days, and what happened on the days they agreed.
Press Pin on two exhibits. The comparison opens by itself when the second one is pinned.

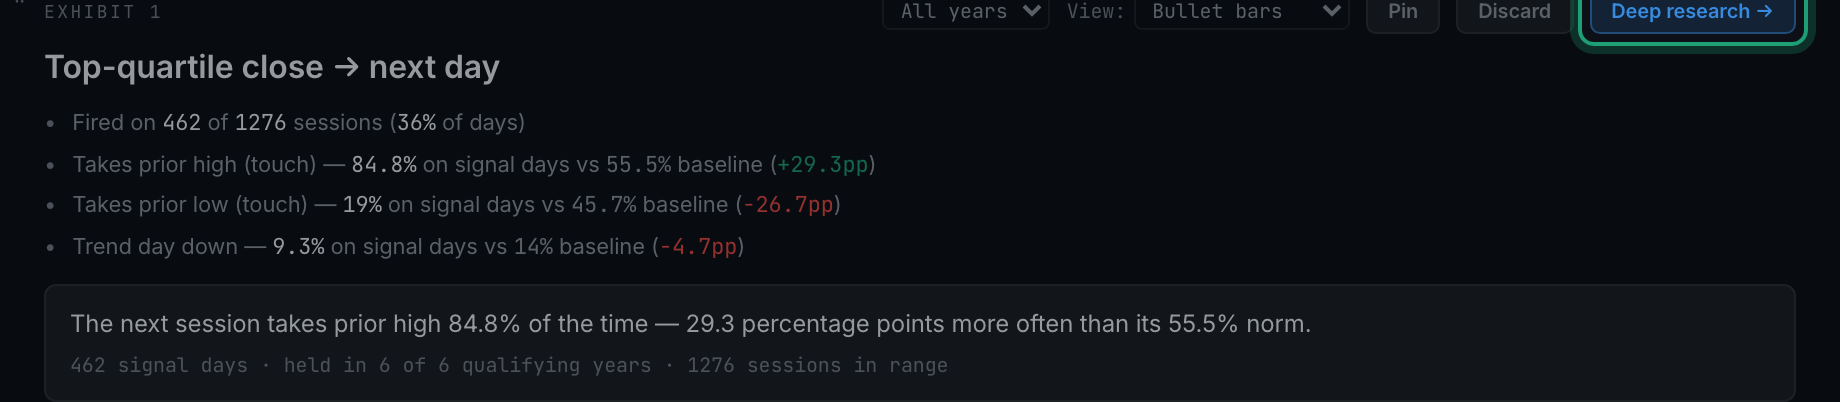
The blue Deep research → button on every exhibit. It opens the same study worked all the way through — every check the app can run on it, as a set of exhibits over the dimmed page.
A header, the condition as an editable sentence, then up to eight exhibits — the main chart, definition sensitivity, year by year, horizons, the backtest, the setup card, the data table, the out-of-sample ledger and the transfer test.
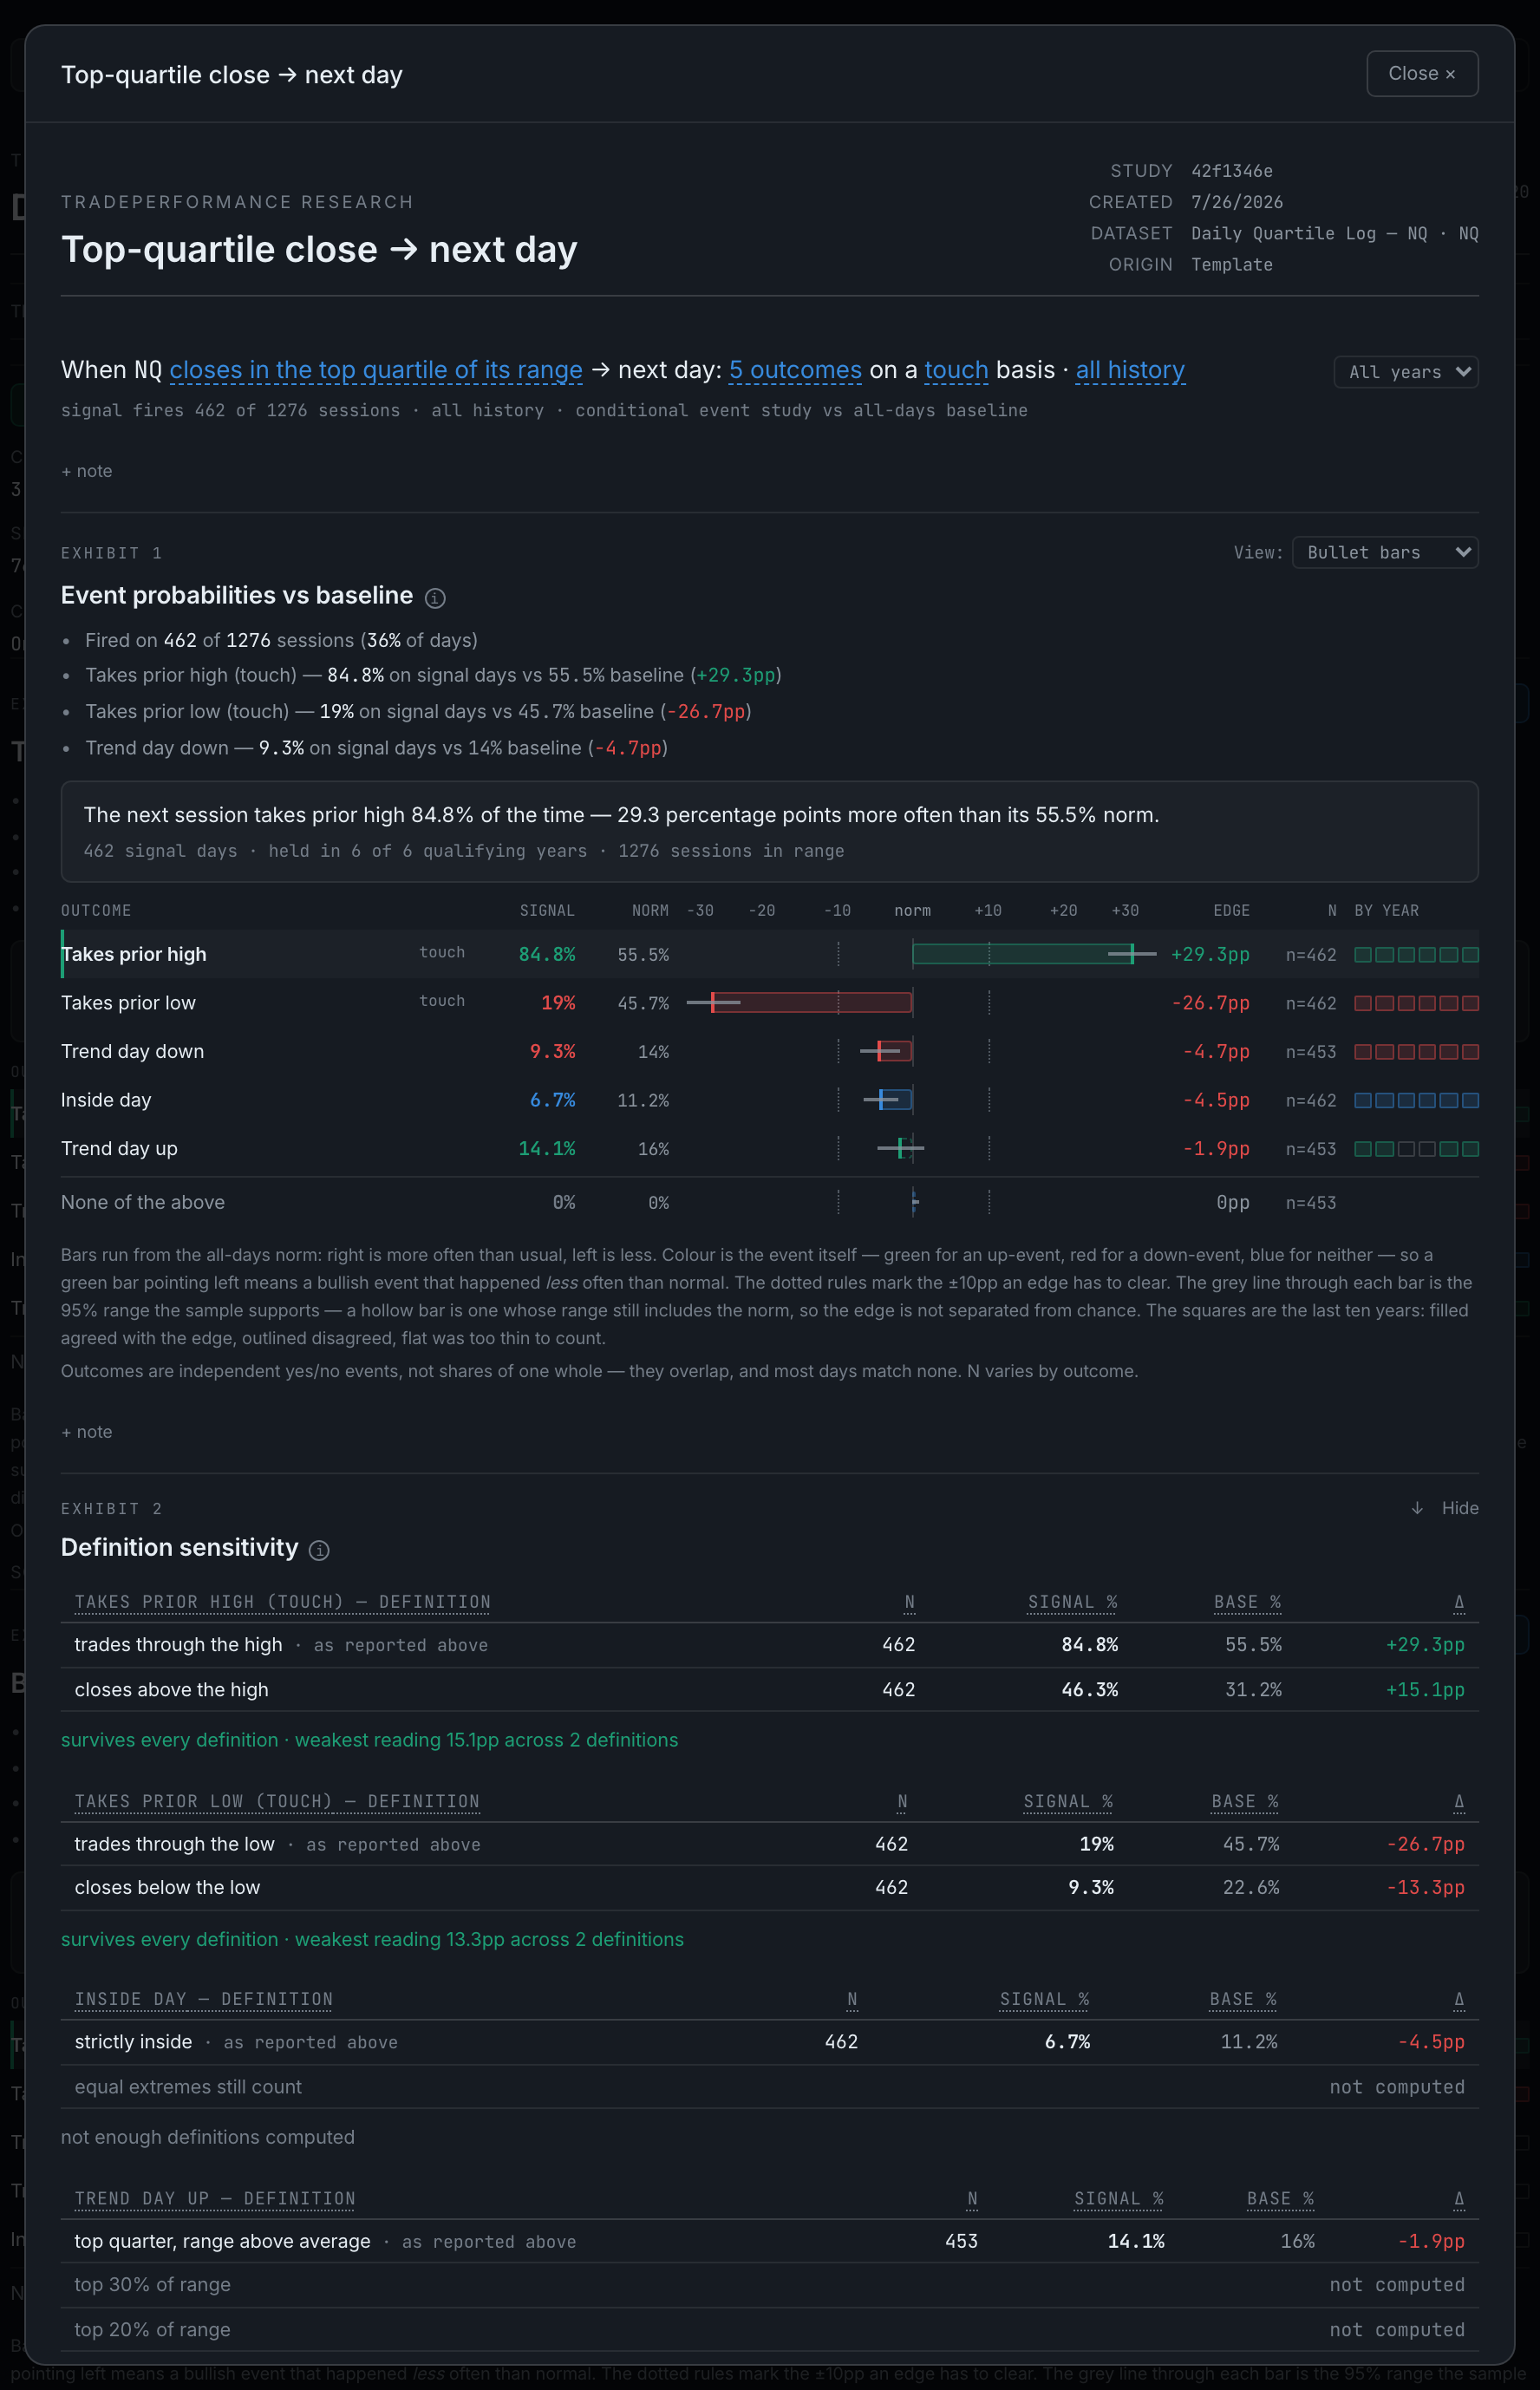
The same study recomputed under every defensible definition of its outcomes. An edge that only exists under one reading of the words is not an edge.
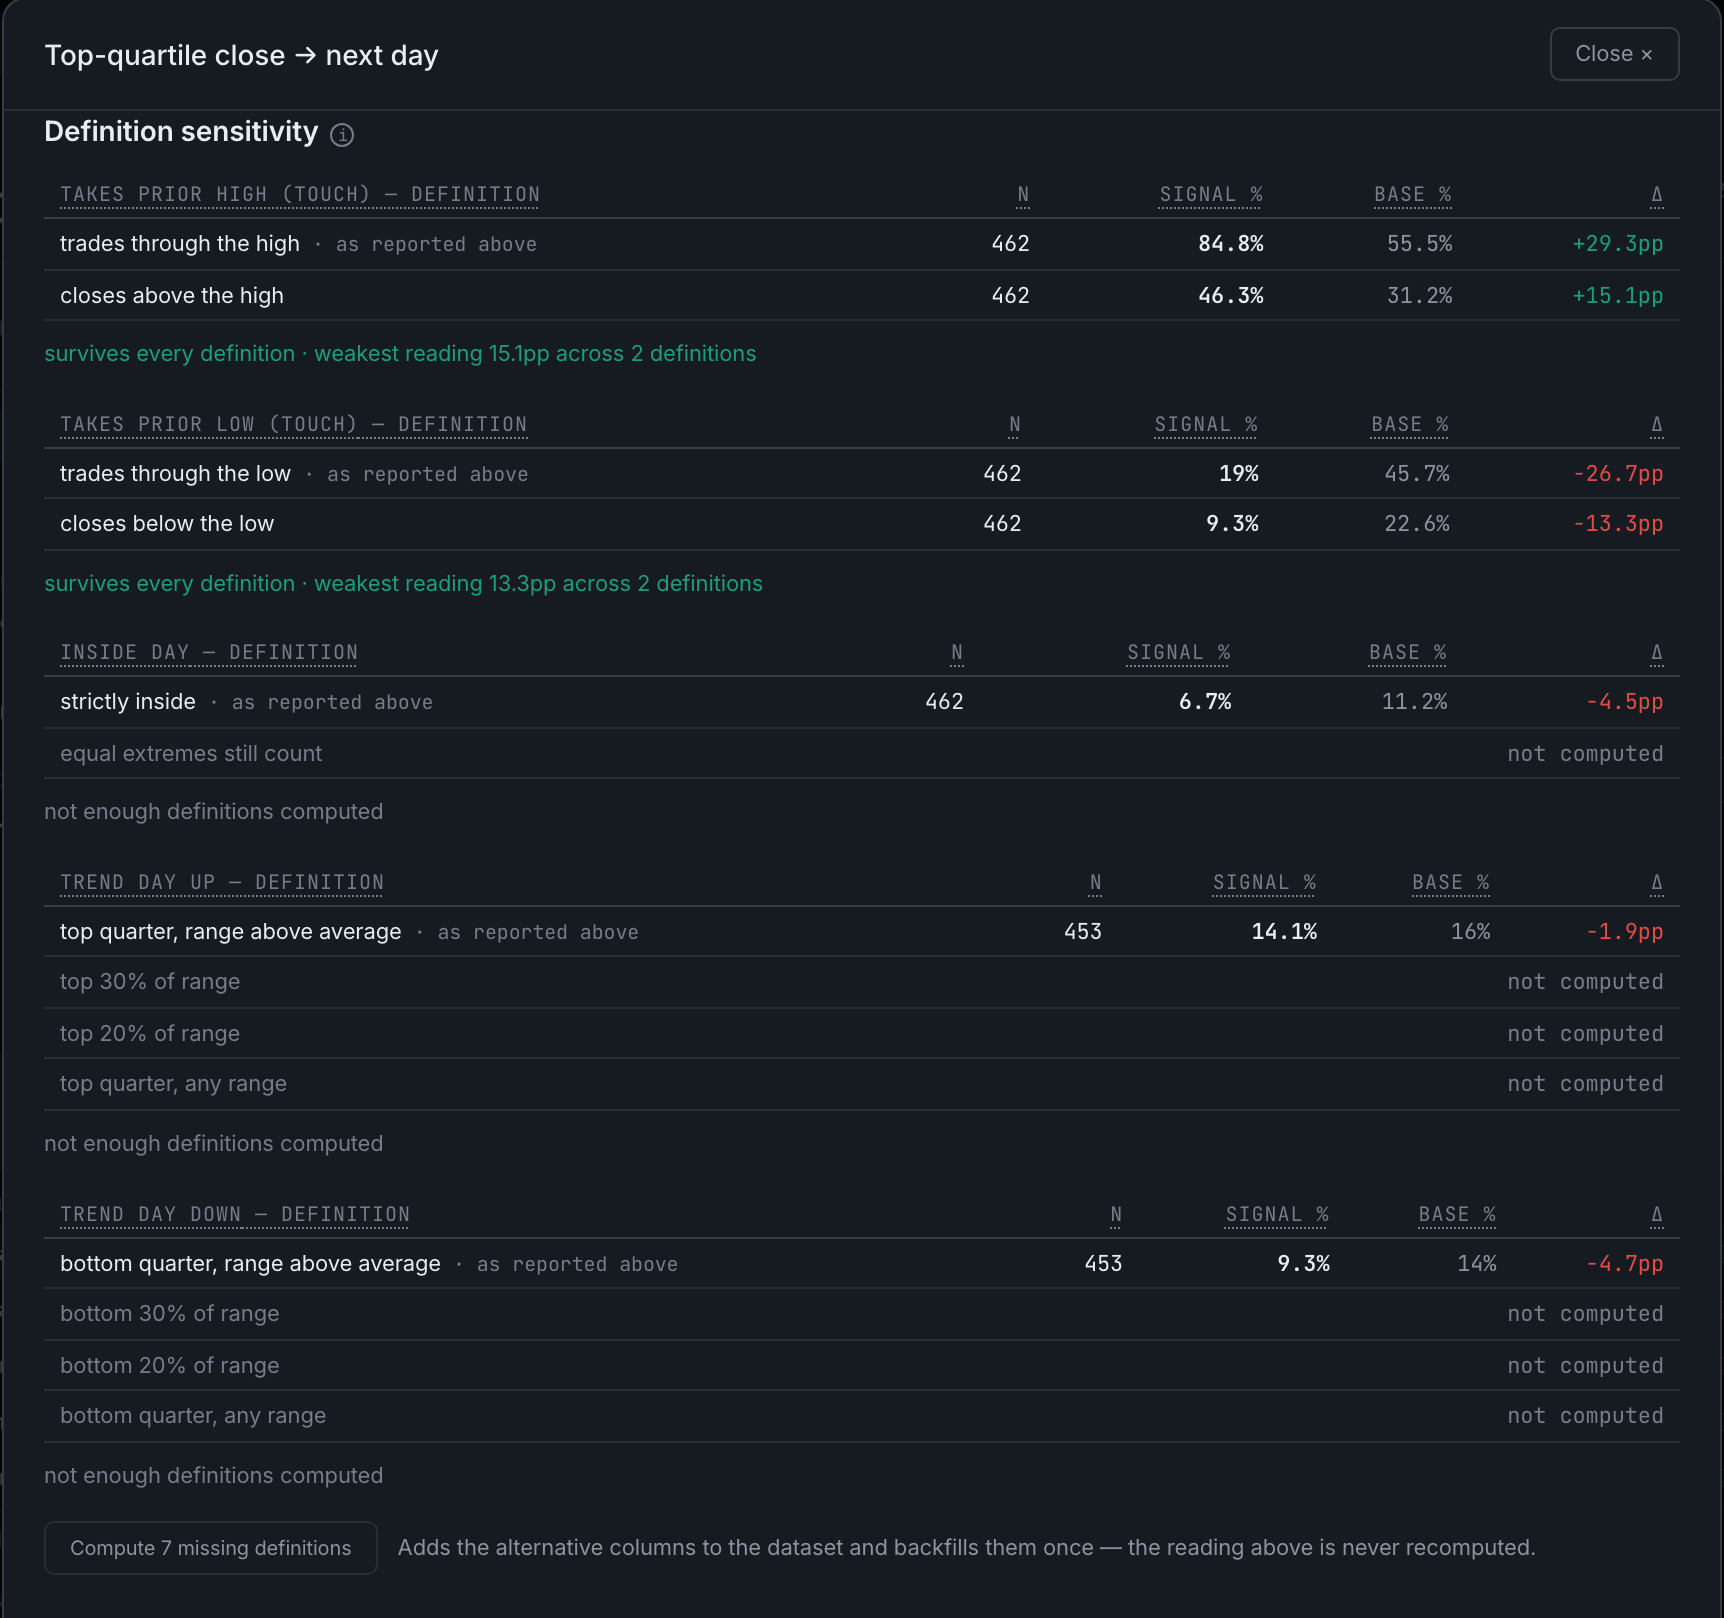
The headline edge split into calendar years, so you can see whether it held every year or lives off one hot stretch.
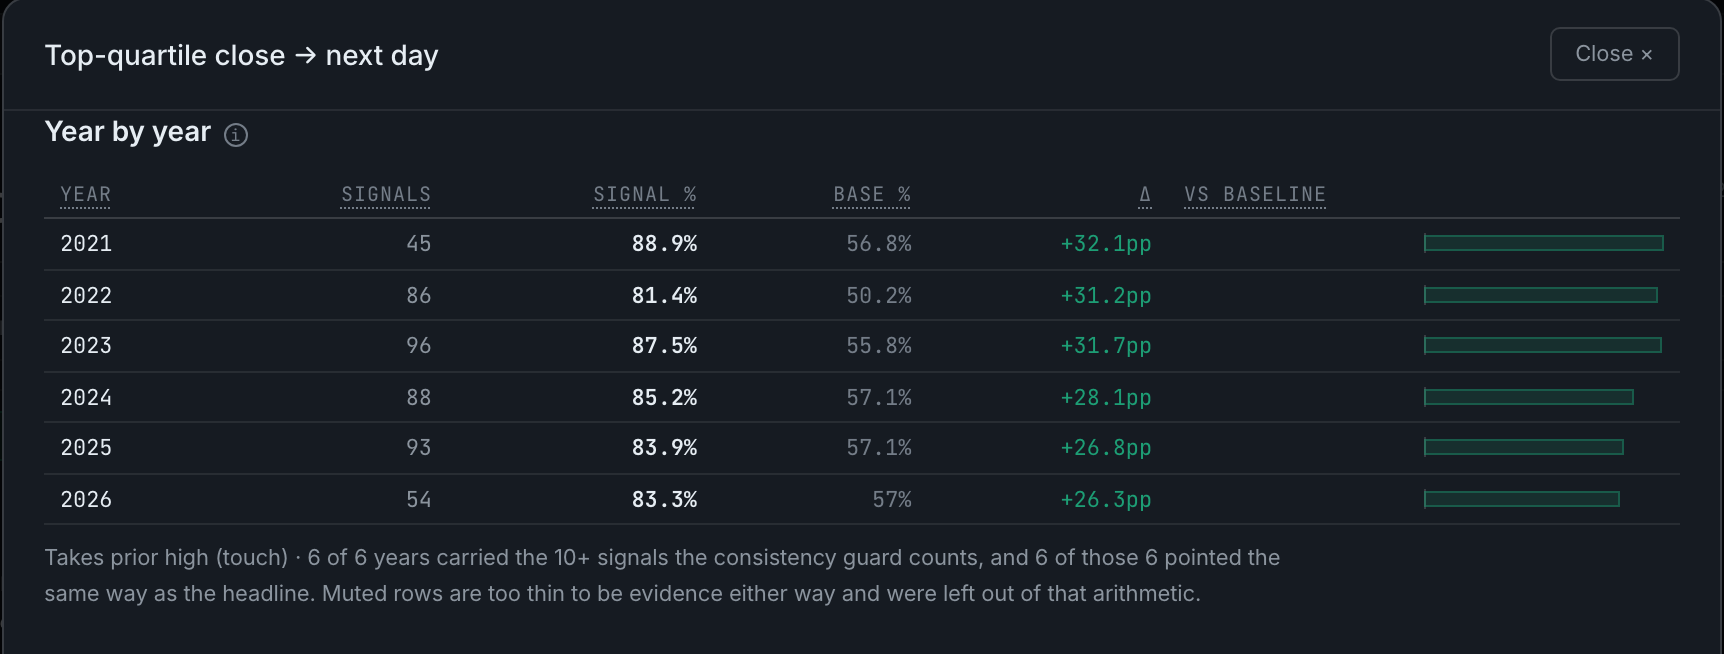
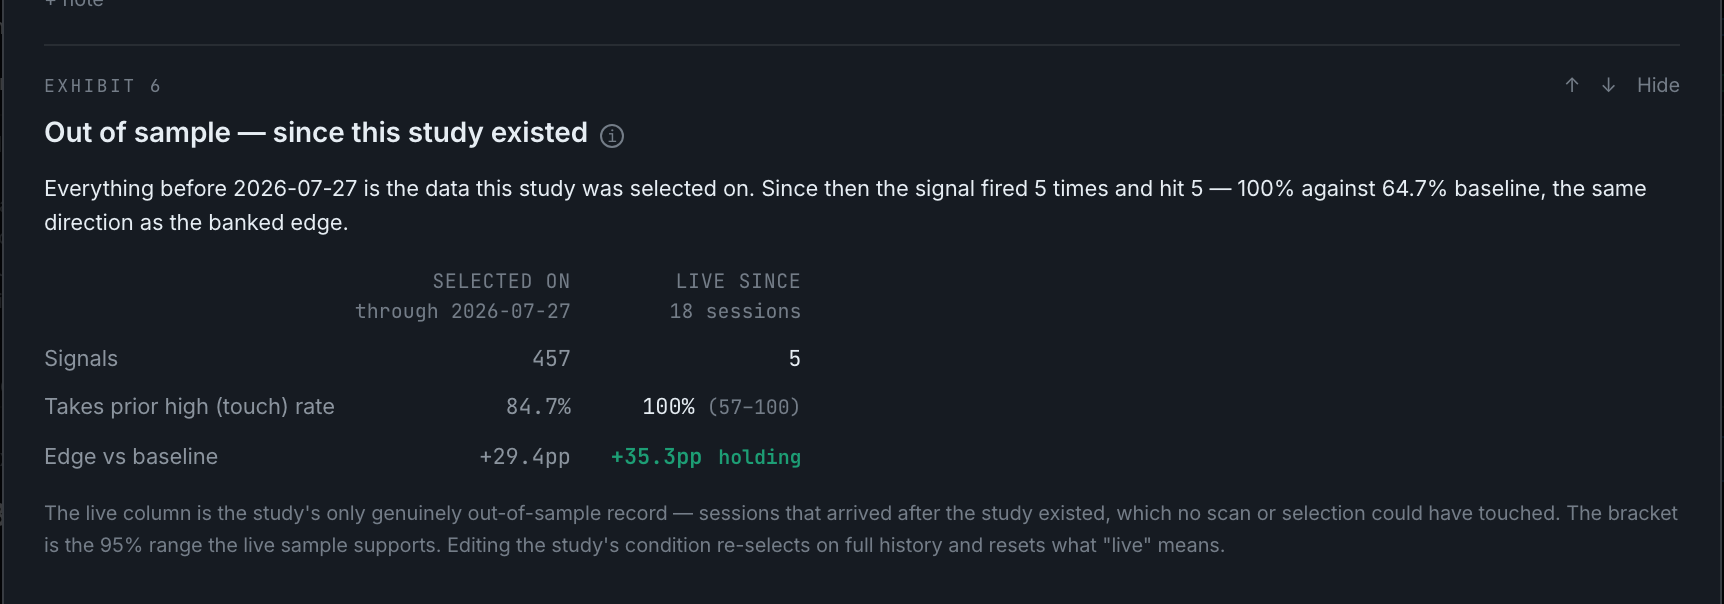
The study's record on sessions that arrived after it was created — the only data no scan or selection could have touched.
The same condition replayed on a different dataset — real sessions the selection never searched.

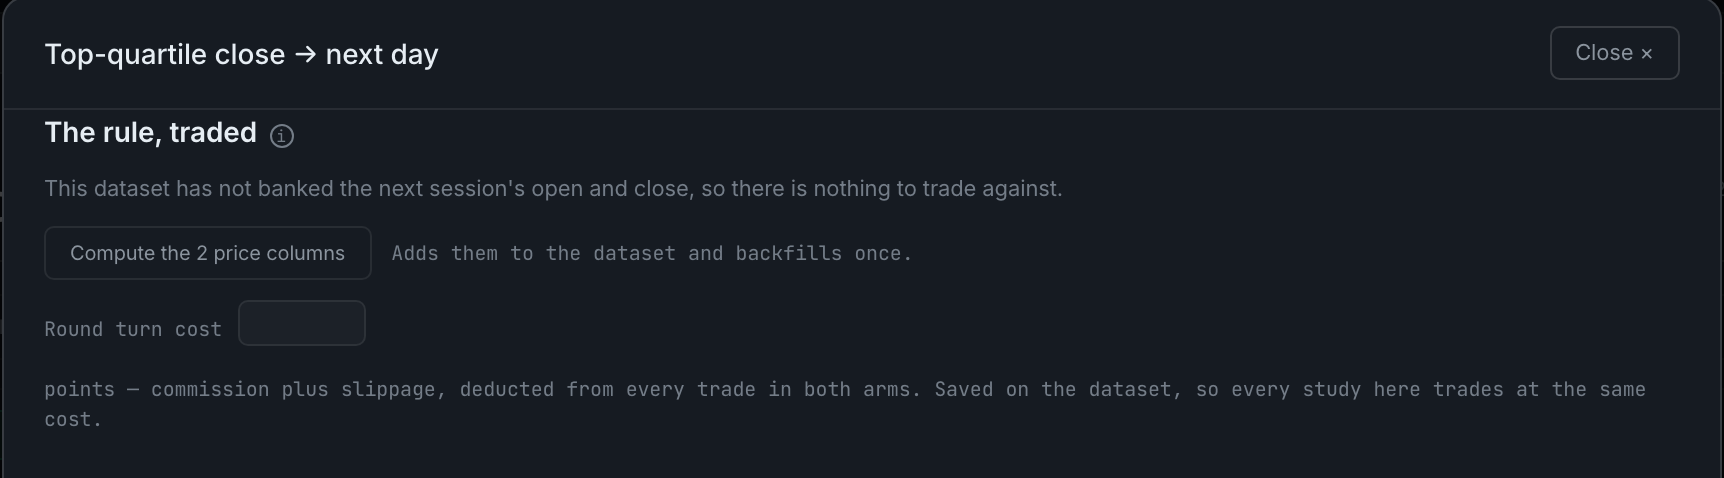
The backtest. It takes the position the next session after every signal, one unit at a time, against a control that trades every single day.
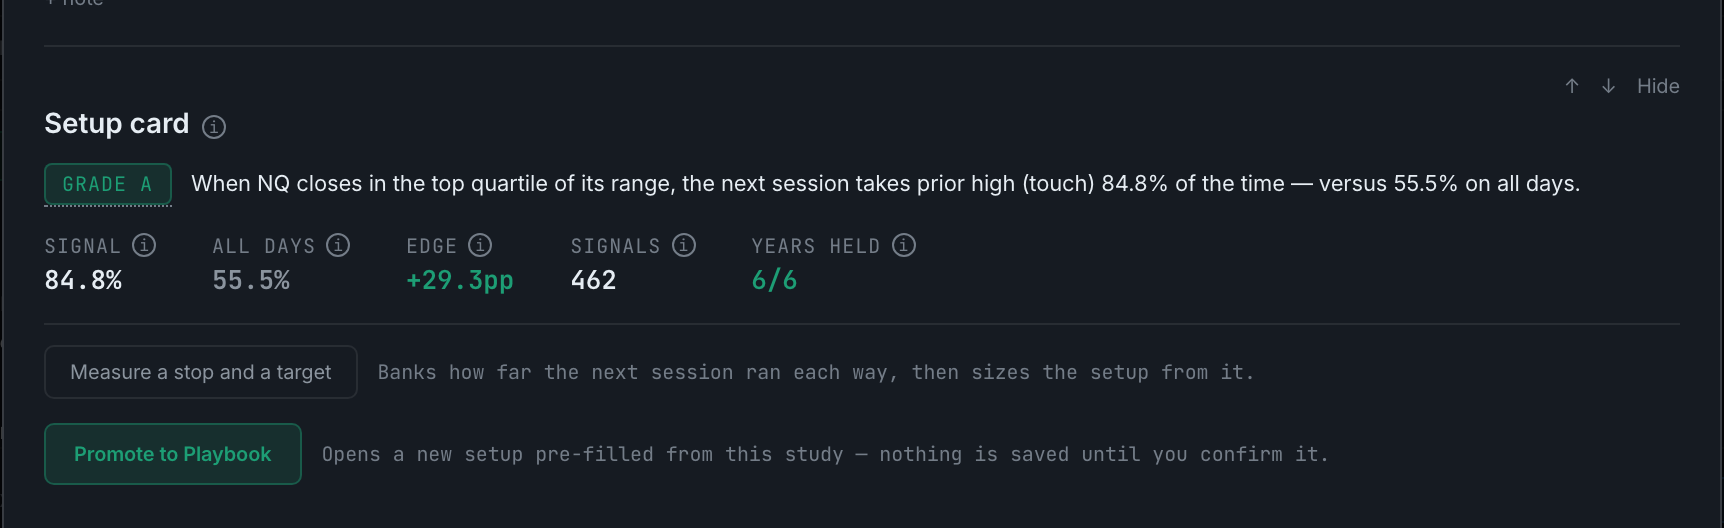
The study condensed into one tradeable sentence with its numbers and grade, and a Promote to Playbook button that opens a new setup pre-filled from it.
Yes. View: switches the chart type, and the year dropdown next to it scopes the sample. Both sit in the exhibit's own control row.

Yes. + note appears between exhibits in a deep research note; what you write is saved on the study and travels into the PNG and PDF exports.
Read the full guideA box that turns a plain-English question into a study — but it shows you the method it intends to use before it computes a single number, and it needs an AI key.

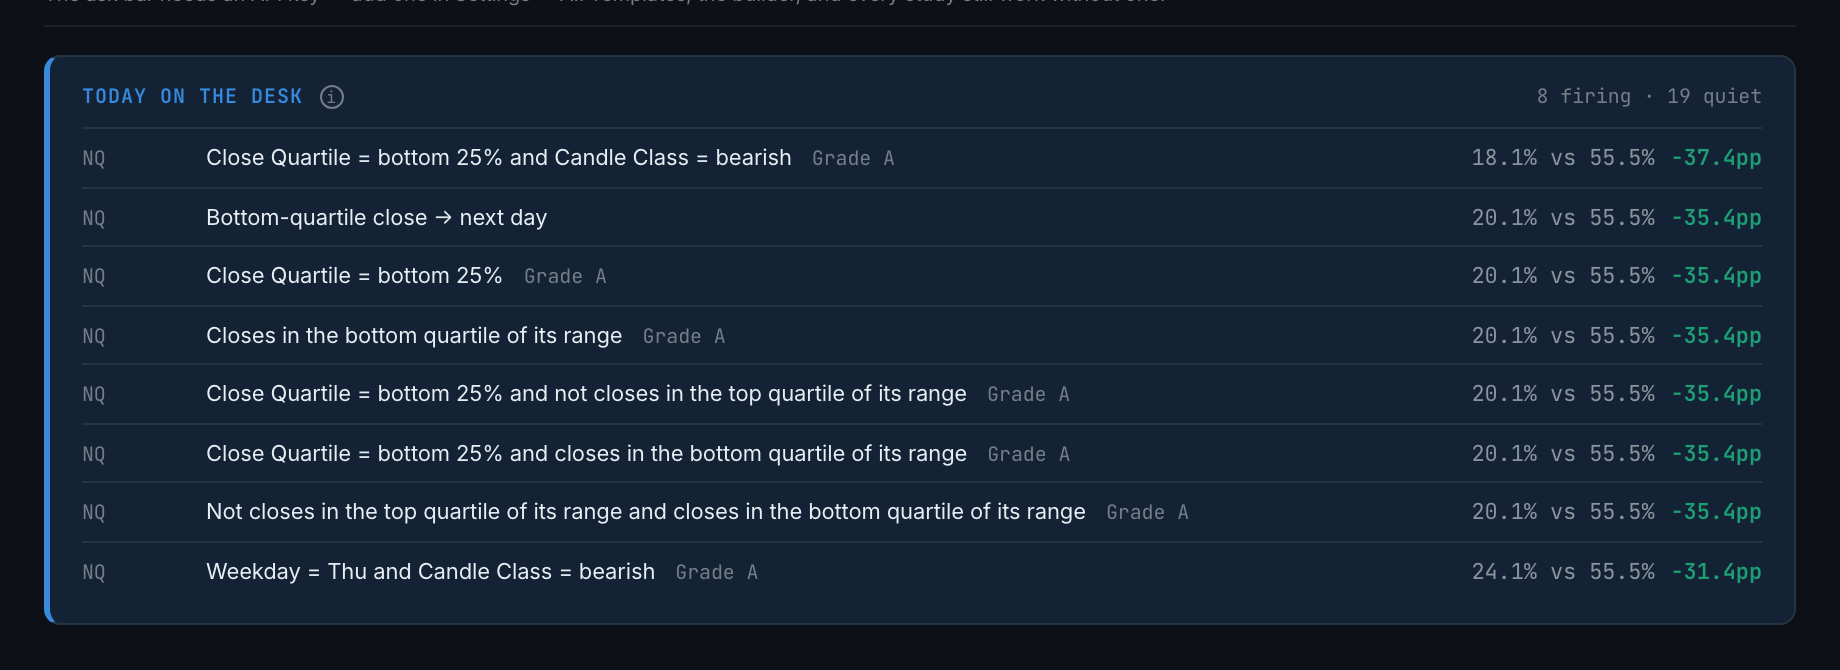
A strip at the top of the desk checking every kept study's condition against the newest session its dataset holds, and listing the ones that are firing right now.