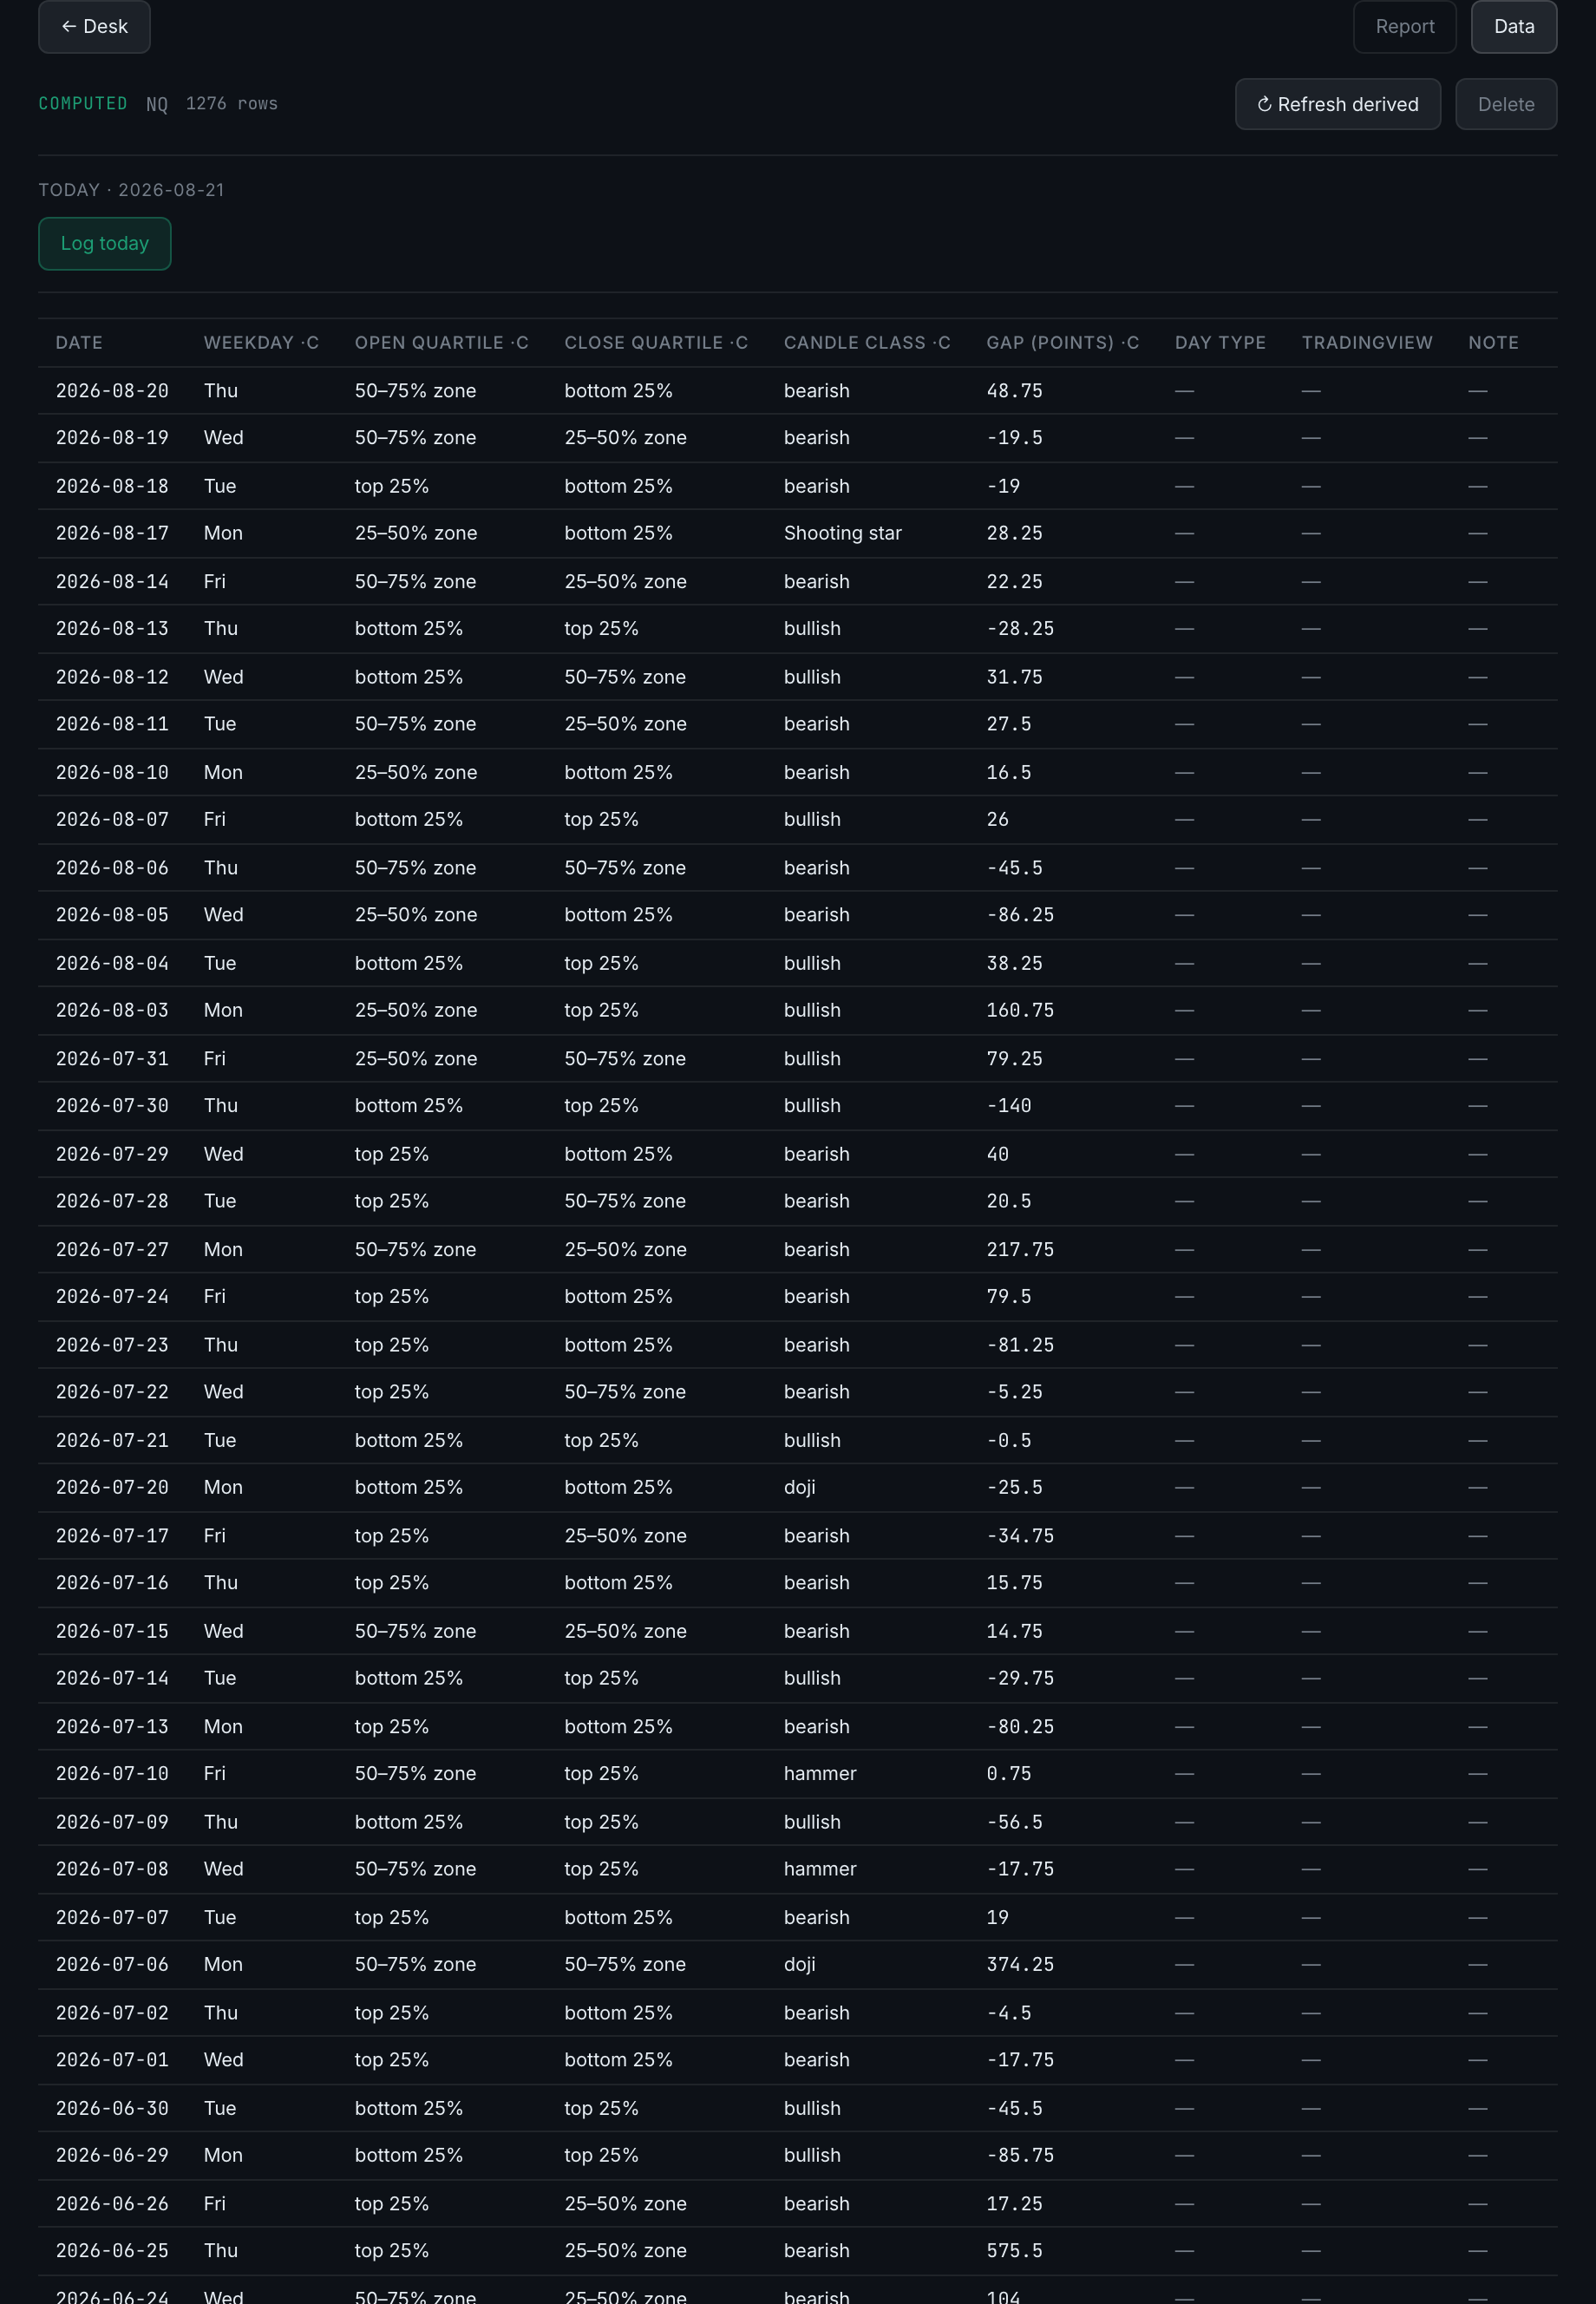
What is on the Data tab?
The dataset itself — every row, newest first, with every column. Click a row to edit its cells.
A dataset report has two tabs, Report and Data. Report is the reading; Data is the underlying table.
The grid shows the date, then every column that is not hidden, with computed ones marked ·c in the header. Rows come newest first, sixty at a time, with a Show more button at the foot that adds another hundred and twenty.
Clicking a row turns its cells into editors. Each one is typed to its column — a select for a category, Yes/No for a boolean, a number box, a text box. Changes save as you leave each field; there is no save button. A delete link appears at the end of the row you are editing.
Above the grid sit the tools that keep the dataset current:
- ↻ Refresh derivedRe-fetches the bars and recomputes every computed column, filling in any sessions that have appeared since. Only shown when the dataset has computed columns and an instrument.
- ⇄ Sync from journalOnly on My trading days, and it rebuilds rather than merges.
- DeleteAsks twice, and the second button tells you how many studies go with it.