What is the year-by-year exhibit?
The headline edge split into calendar years, so you can see whether it held every year or lives off one hot stretch.
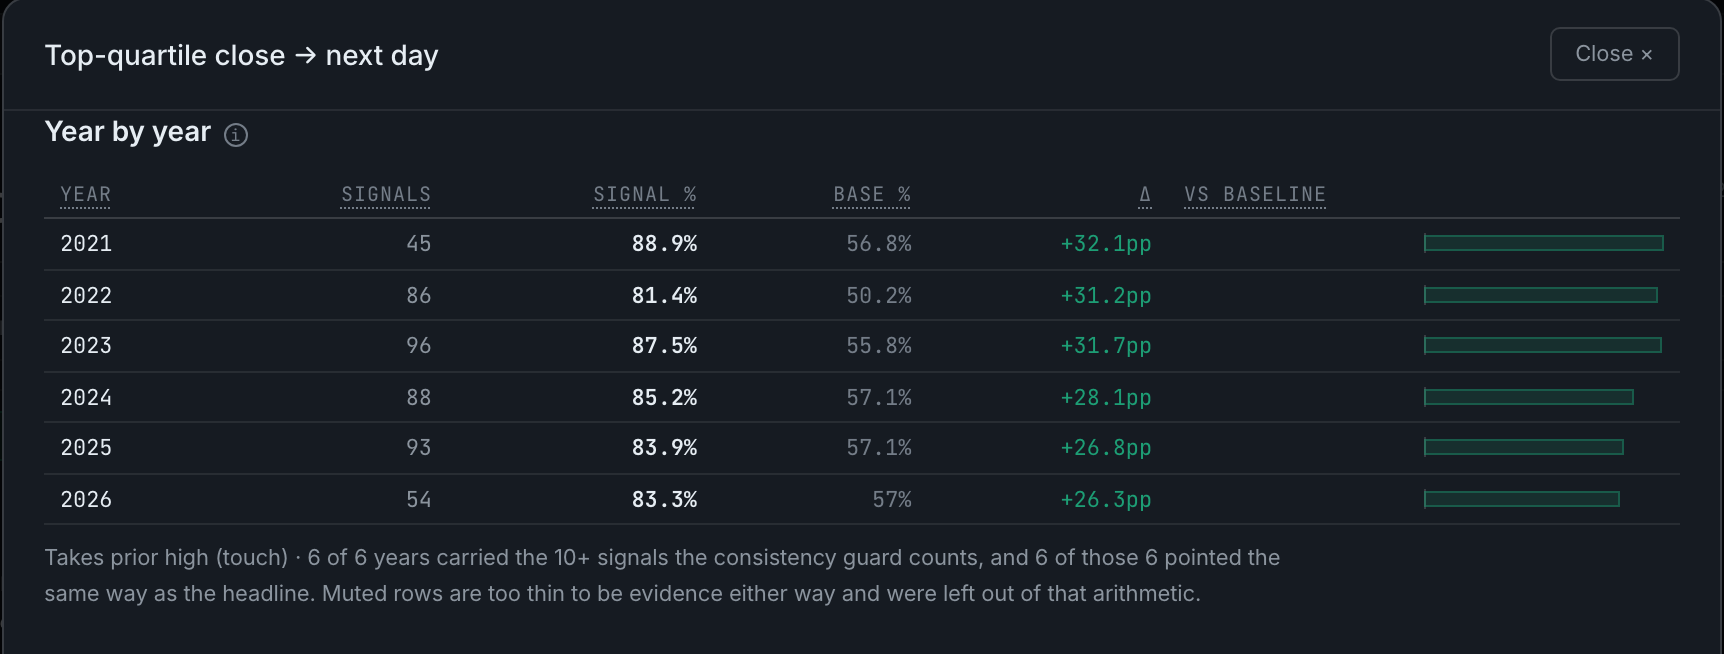
One row per year: how many signals fired, the signal rate, the base rate, the gap, and a bar drawing that gap against the baseline.
Read the signals column first. A year with fewer than 10 signals is too thin to be evidence either way; those rows are muted and are left out of the consistency arithmetic entirely rather than counted as agreement. The sentence under the table states this explicitly — how many years carried enough signals, and how many of those pointed the same way as the headline.
This is the exhibit that separates a real edge from a single good year. Six years agreeing at +26 to +32 points is a different claim from one year at +70 and five at zero, and both can produce the same headline number.