What is Deep research?
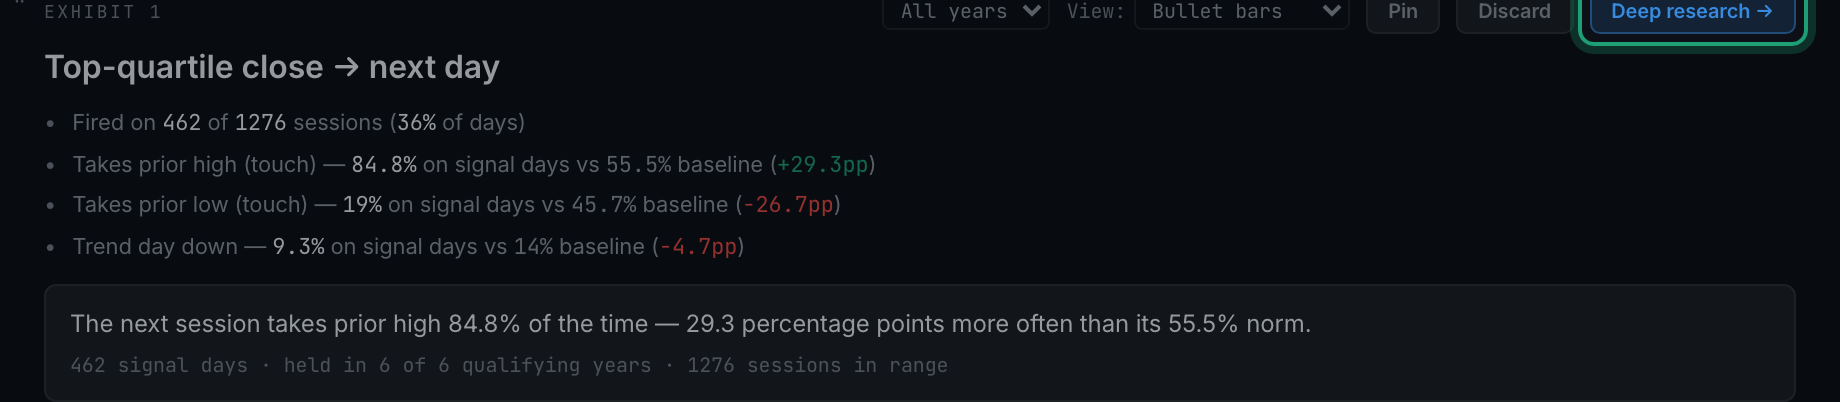
The blue Deep research → button on every exhibit. It opens the same study worked all the way through — every check the app can run on it, as a set of exhibits over the dimmed page.
An exhibit on the report is the headline. Deep research is the argument behind it.
The report has to fit a dozen studies on one page, so each gets a title, three bullets and a chart. That is enough to notice something. It is not enough to decide whether it is real — that takes the year-by-year split, the alternative definitions, the out-of-sample record and the rest, and those need a page each.
If you have read the Analytics guides, this is the same idea you met there as Full Report ↗, and it is worth saying plainly that the two are the same feature wearing different clothes. Analytics puts a quiet ↗ in a panel's top-right corner. Stats puts a blue Deep research → button in the exhibit's control row, next to Pin and Discard. Look for the button rather than the corner here — and note that the exhibit's title opens it too, which is the older affordance kept alive.
Two differences that matter:
- An Analytics report is read-only; a deep research note is not. You can reorder its exhibits, hide ones you do not want, write notes between them, and export the result. Those choices are saved on the study and are there next time.
- Opening one banks a verdict. The definition-sensitivity check is the only thing that can compute the reverses and weakens verdicts, and opening the study is the only moment the app runs it — so it writes the answer back onto the study, which is how the desk row and the report card can show it without loading anything.
To close it: Close × in the title bar, or click the dimmed area outside it.