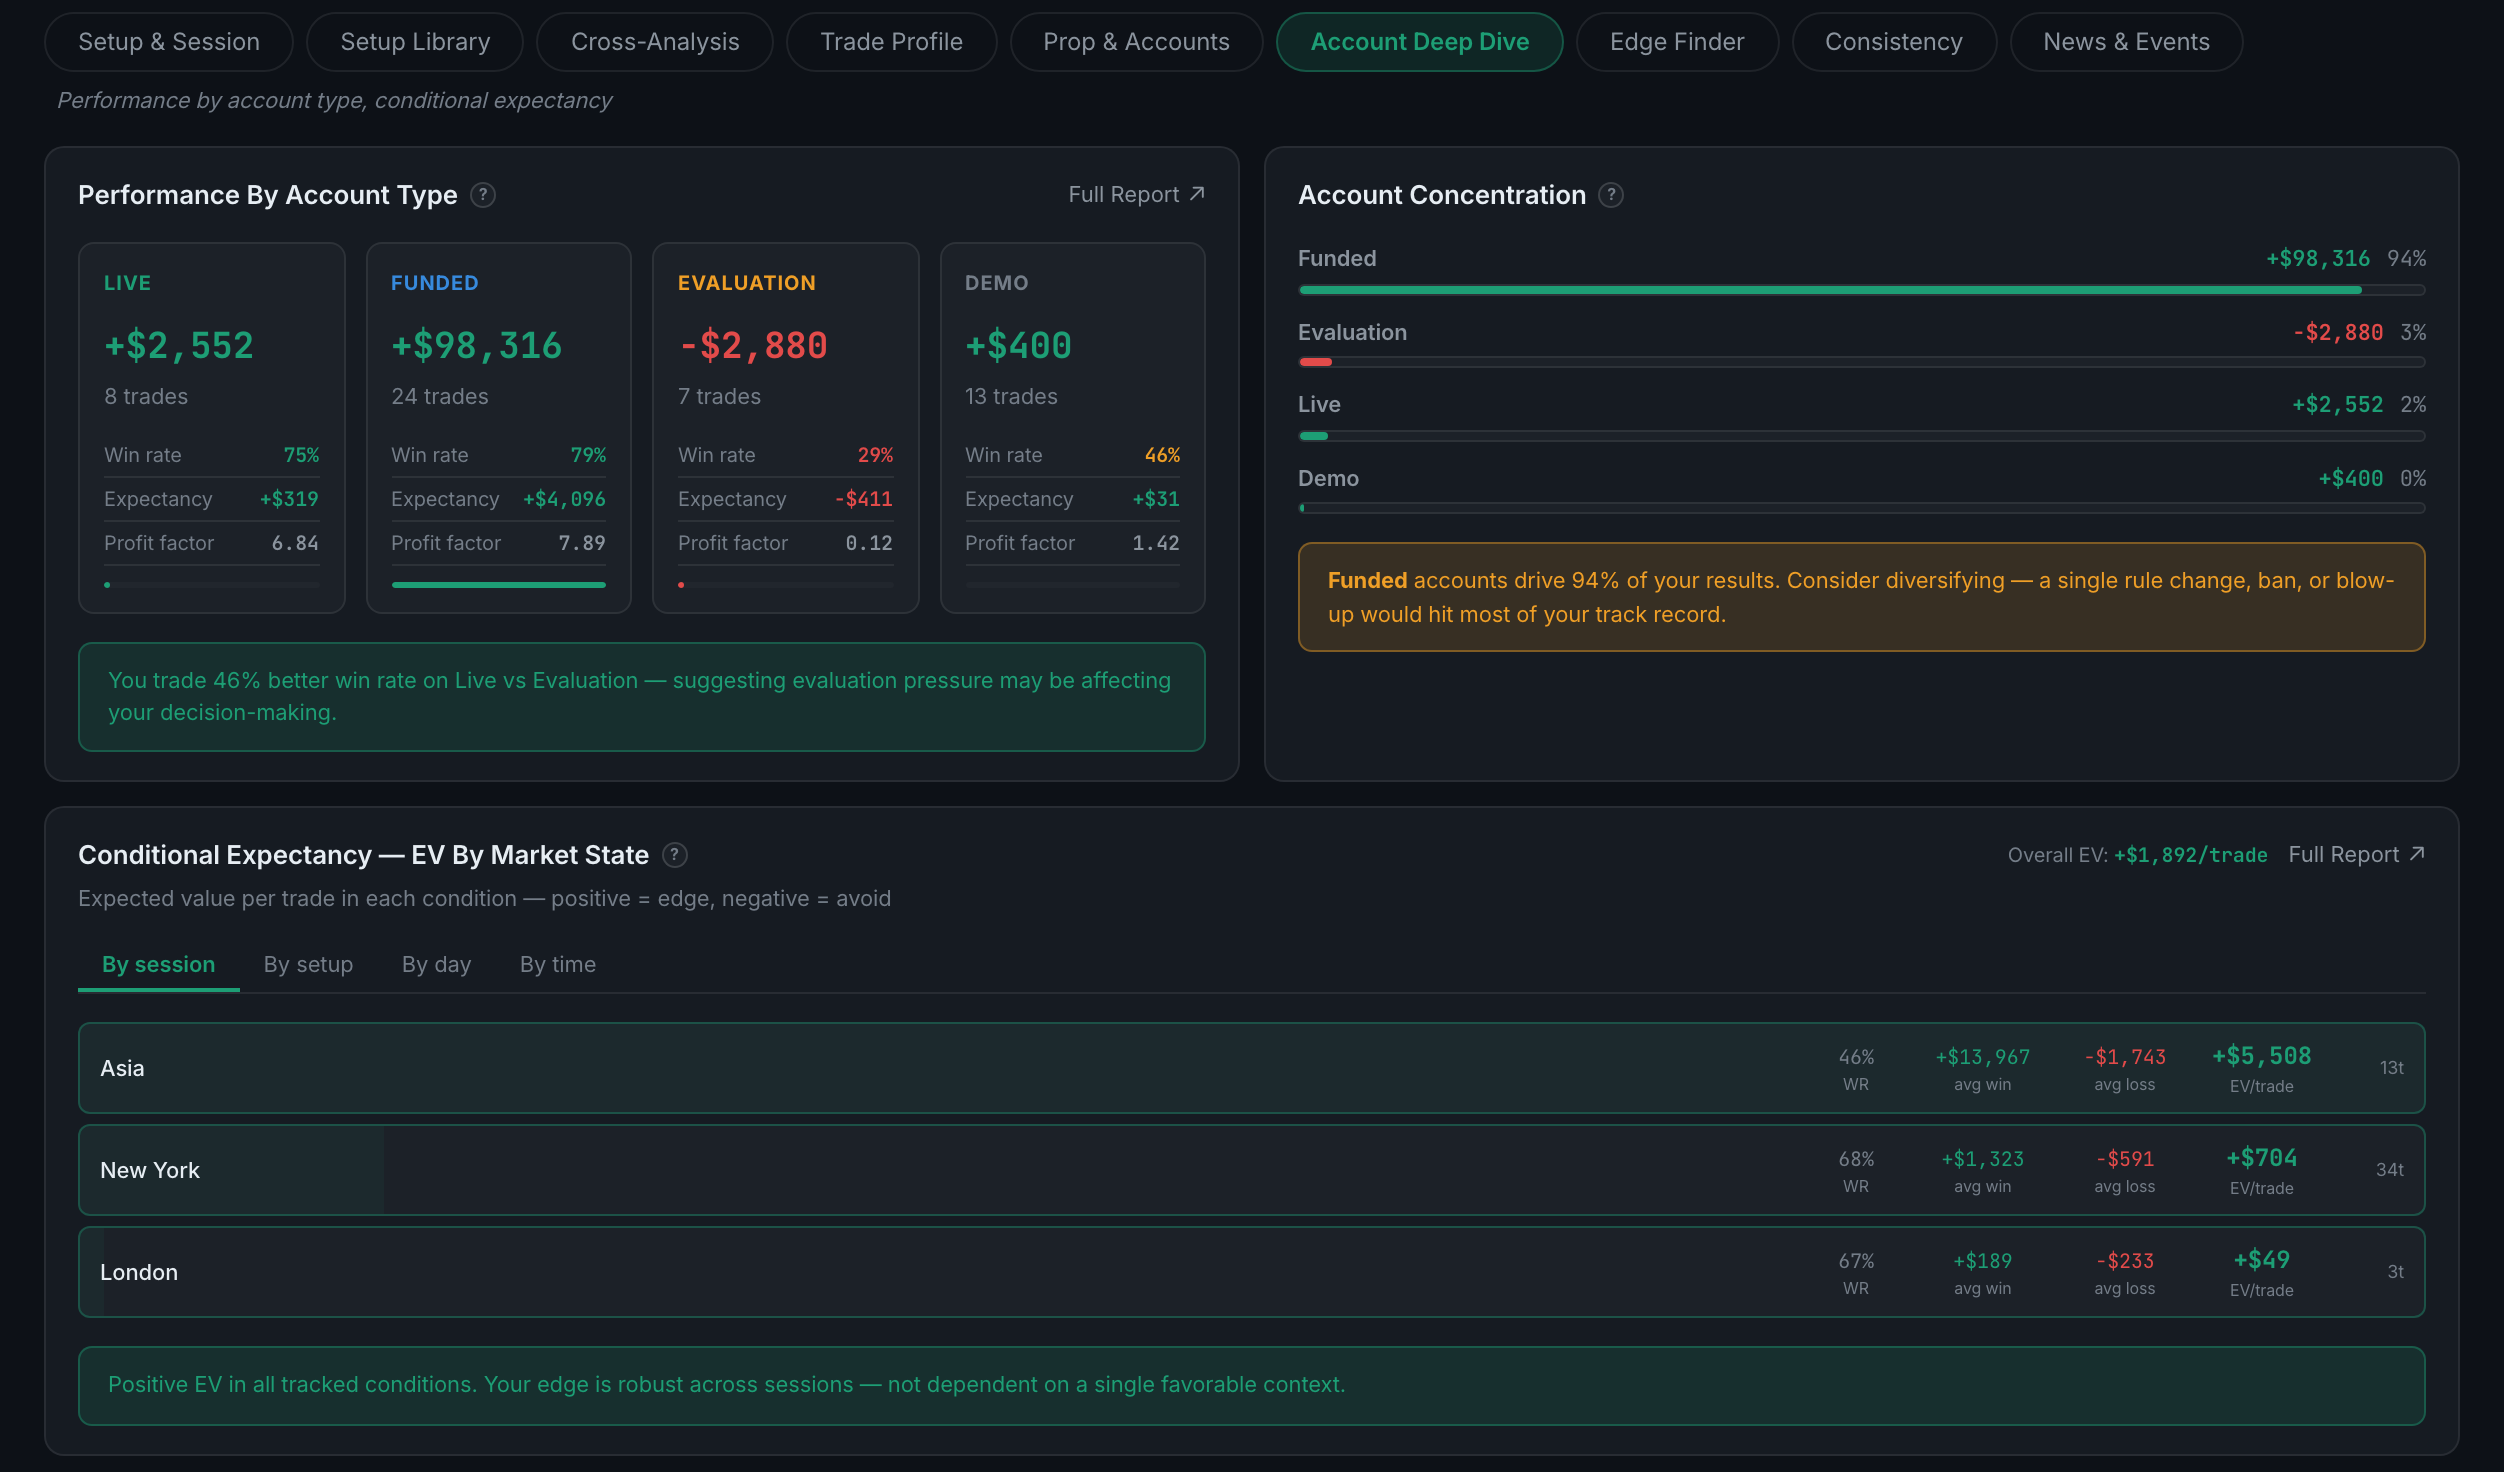
What is on the Account Deep Dive sub-page?
Performance by type of account rather than by individual account, plus concentration and conditional expectancy.
The distinction from the previous sub-page matters. That one compares your named accounts; this one groups them — Live, Funded, Evaluation, Demo — and asks whether you trade differently when the money is real. A large gap between demo and funded is a psychology finding wearing an accounting hat.
Indicators on this sub-page:
- Performance by Account TypeA card per type — live, funded, evaluation, demo — with net P&L, trades, win rate, expectancy and profit factor, and a written comparison underneath. That comparison is the one to read: a large win-rate gap between live and evaluation is not an accounting fact, it is evaluation pressure changing how you trade.
- Account ConcentrationEach type as a share of your total, with a warning when one dominates. A single account carrying 94% of your record means one rule change or one blow-up takes most of your track record with it.
- Conditional Expectancy — EV by Market StateExpected value per trade in each condition, positive meaning edge and negative meaning avoid, with win rate, average win, average loss, EV per trade and trade count per row. The dimension is switchable — by session, by setup, by day or by time — and your overall EV sits in the header for comparison. It closes by saying whether your edge is robust across conditions or dependent on one favourable context.
Needs two or more account types with trades before it will compare.