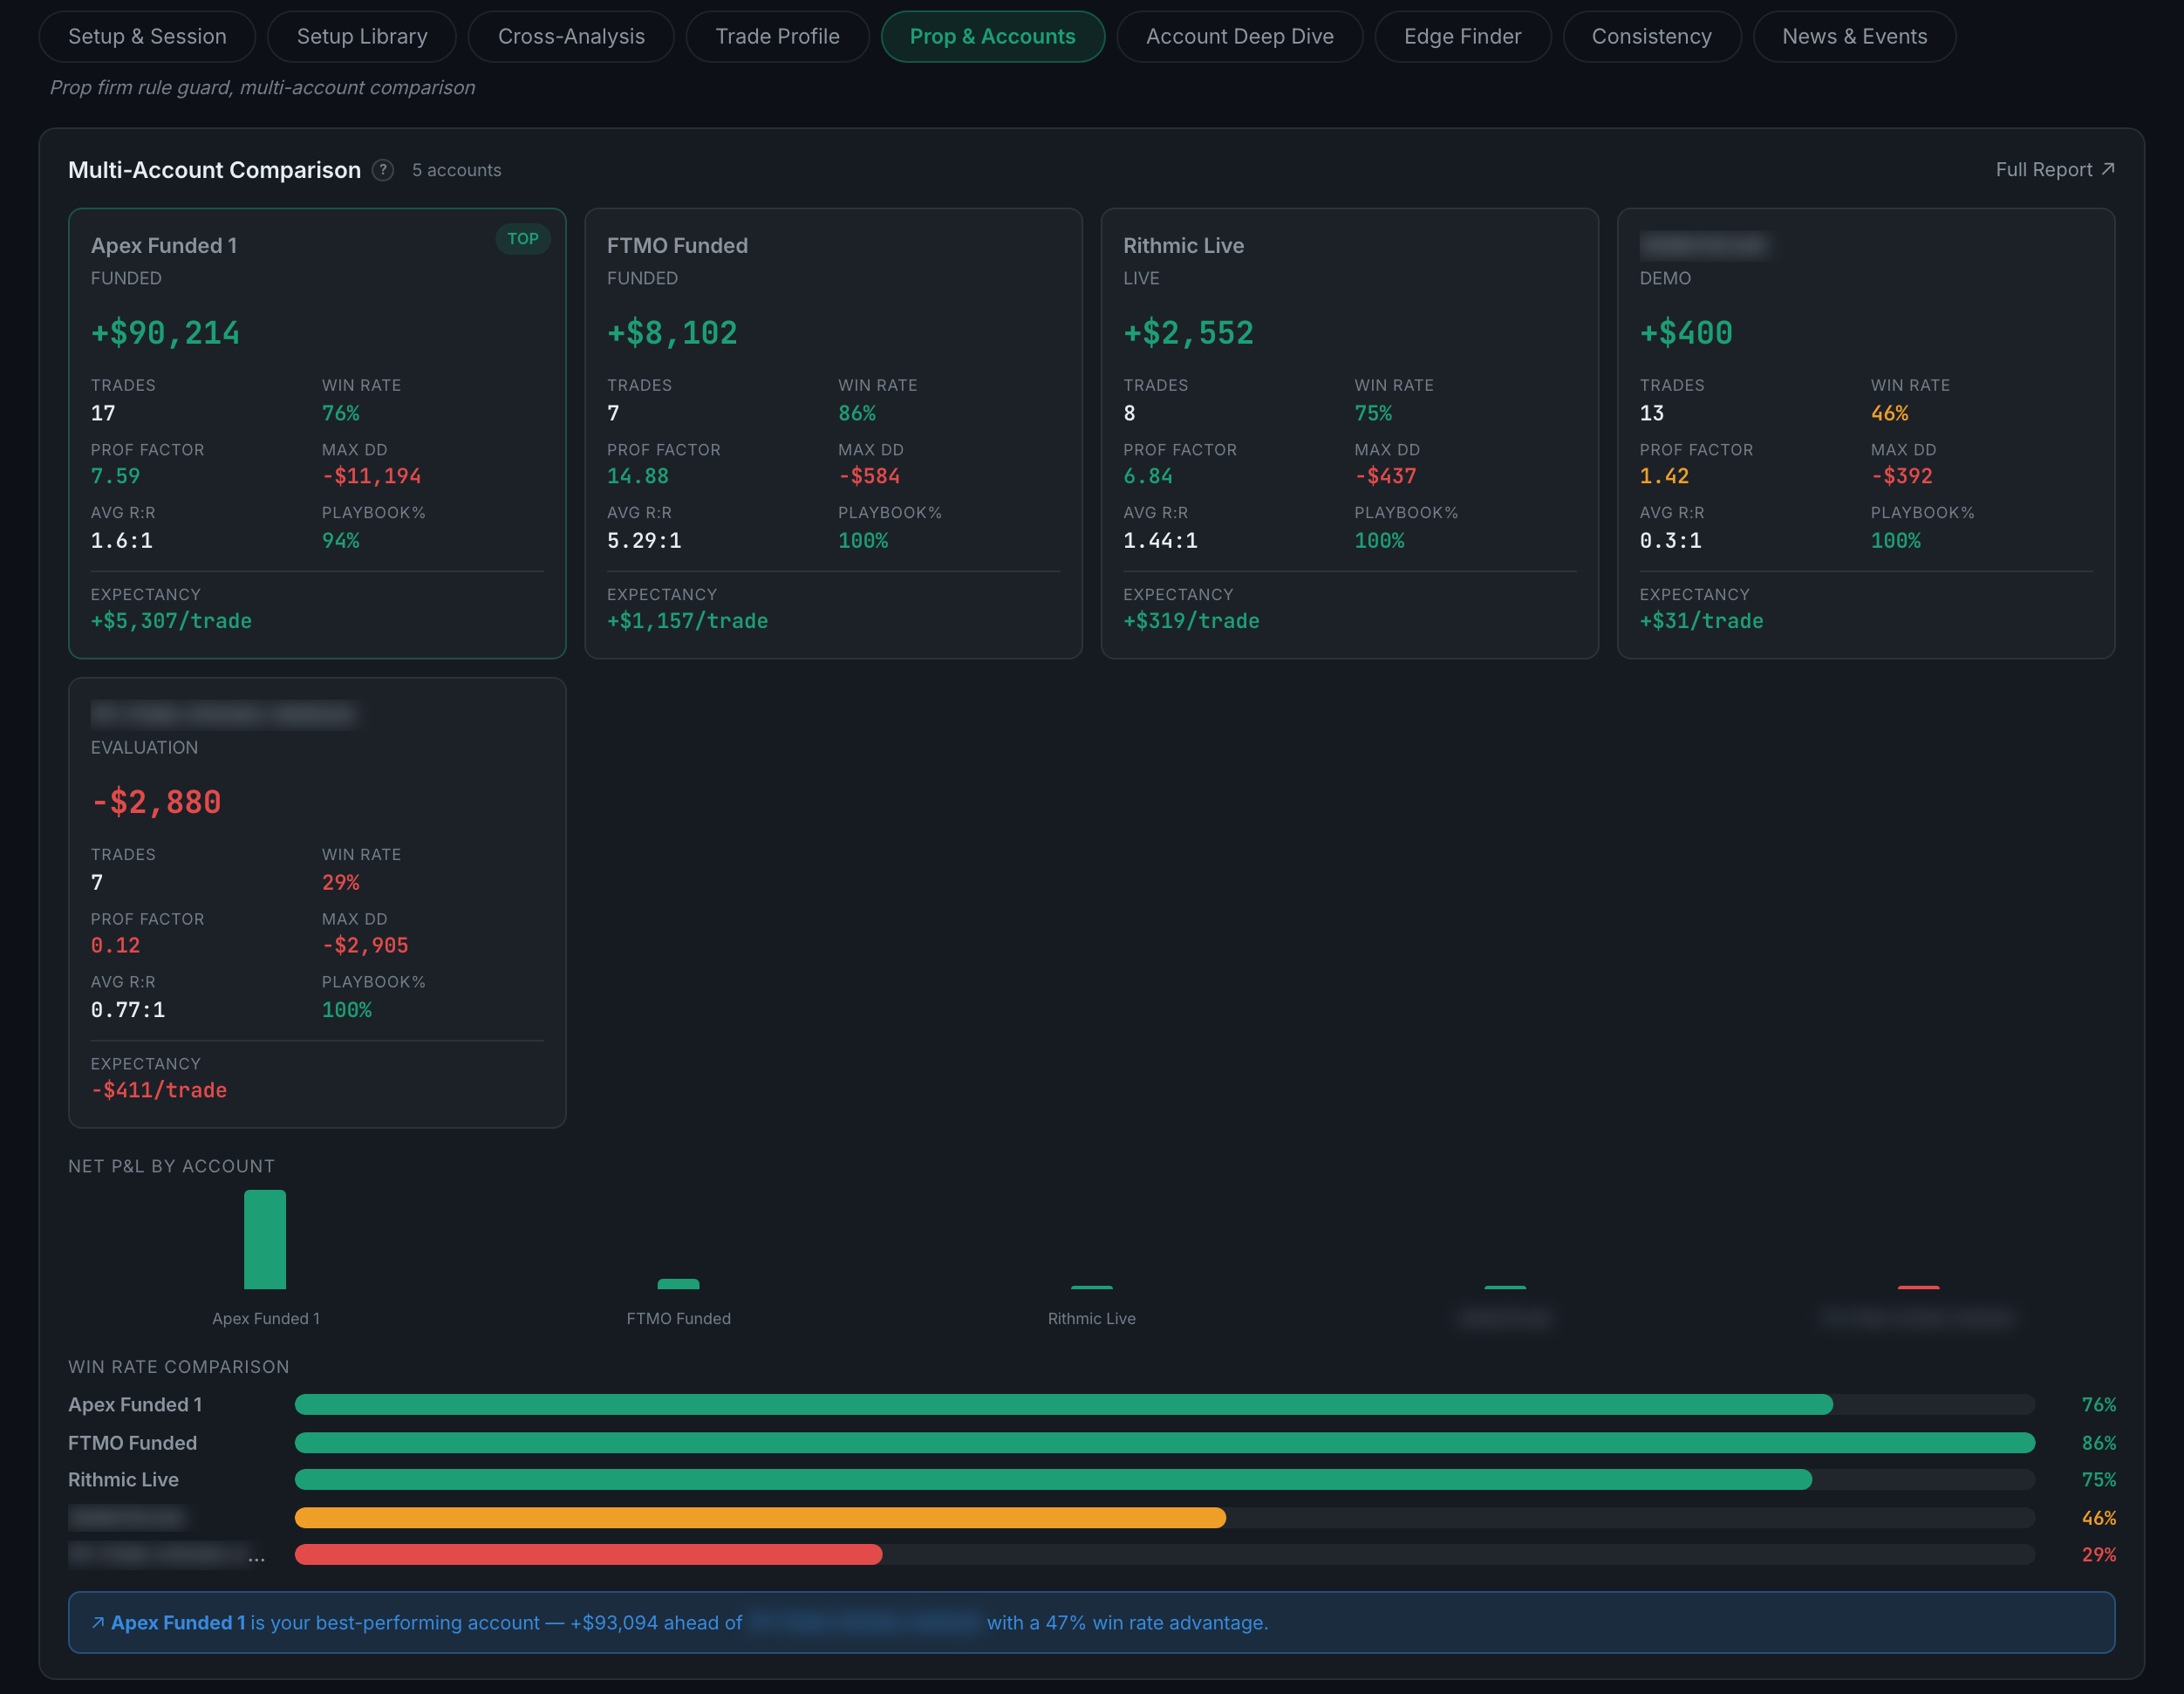
What is on the Prop & Accounts sub-page?
One panel — a side-by-side comparison of every account you trade, sorted by net P&L.
If you trade one account this sub-page is locked. If you trade a live account, two evaluations and a demo, it is the most useful page in the tab, because everything else in Analytics blends your accounts together unless you filter.
Indicators on this sub-page:
- Multi-Account ComparisonA card per account showing net P&L, trades, win rate, profit factor, max drawdown, average R:R, playbook percentage and expectancy per trade. The strongest account is marked TOP.
- Net P&L by accountThe same totals as a bar chart.
- Win rate comparisonOne bar per account, colour-coded.
- A summary line naming your best account and how far ahead of the worst it is.
The hint line under the strip is misleading here. It reads "Prop firm rule guard, multi-account comparison", but the rule guard is not on this sub-page — it is a banner on the Dashboard. Prop firm pass probability is a different thing again, and lives on Risk → Prop & Simulation.
Needs two or more accounts with trades in the selected period; with one account it stays locked. Account identifiers appear in full in the app — the screenshots here blur them.