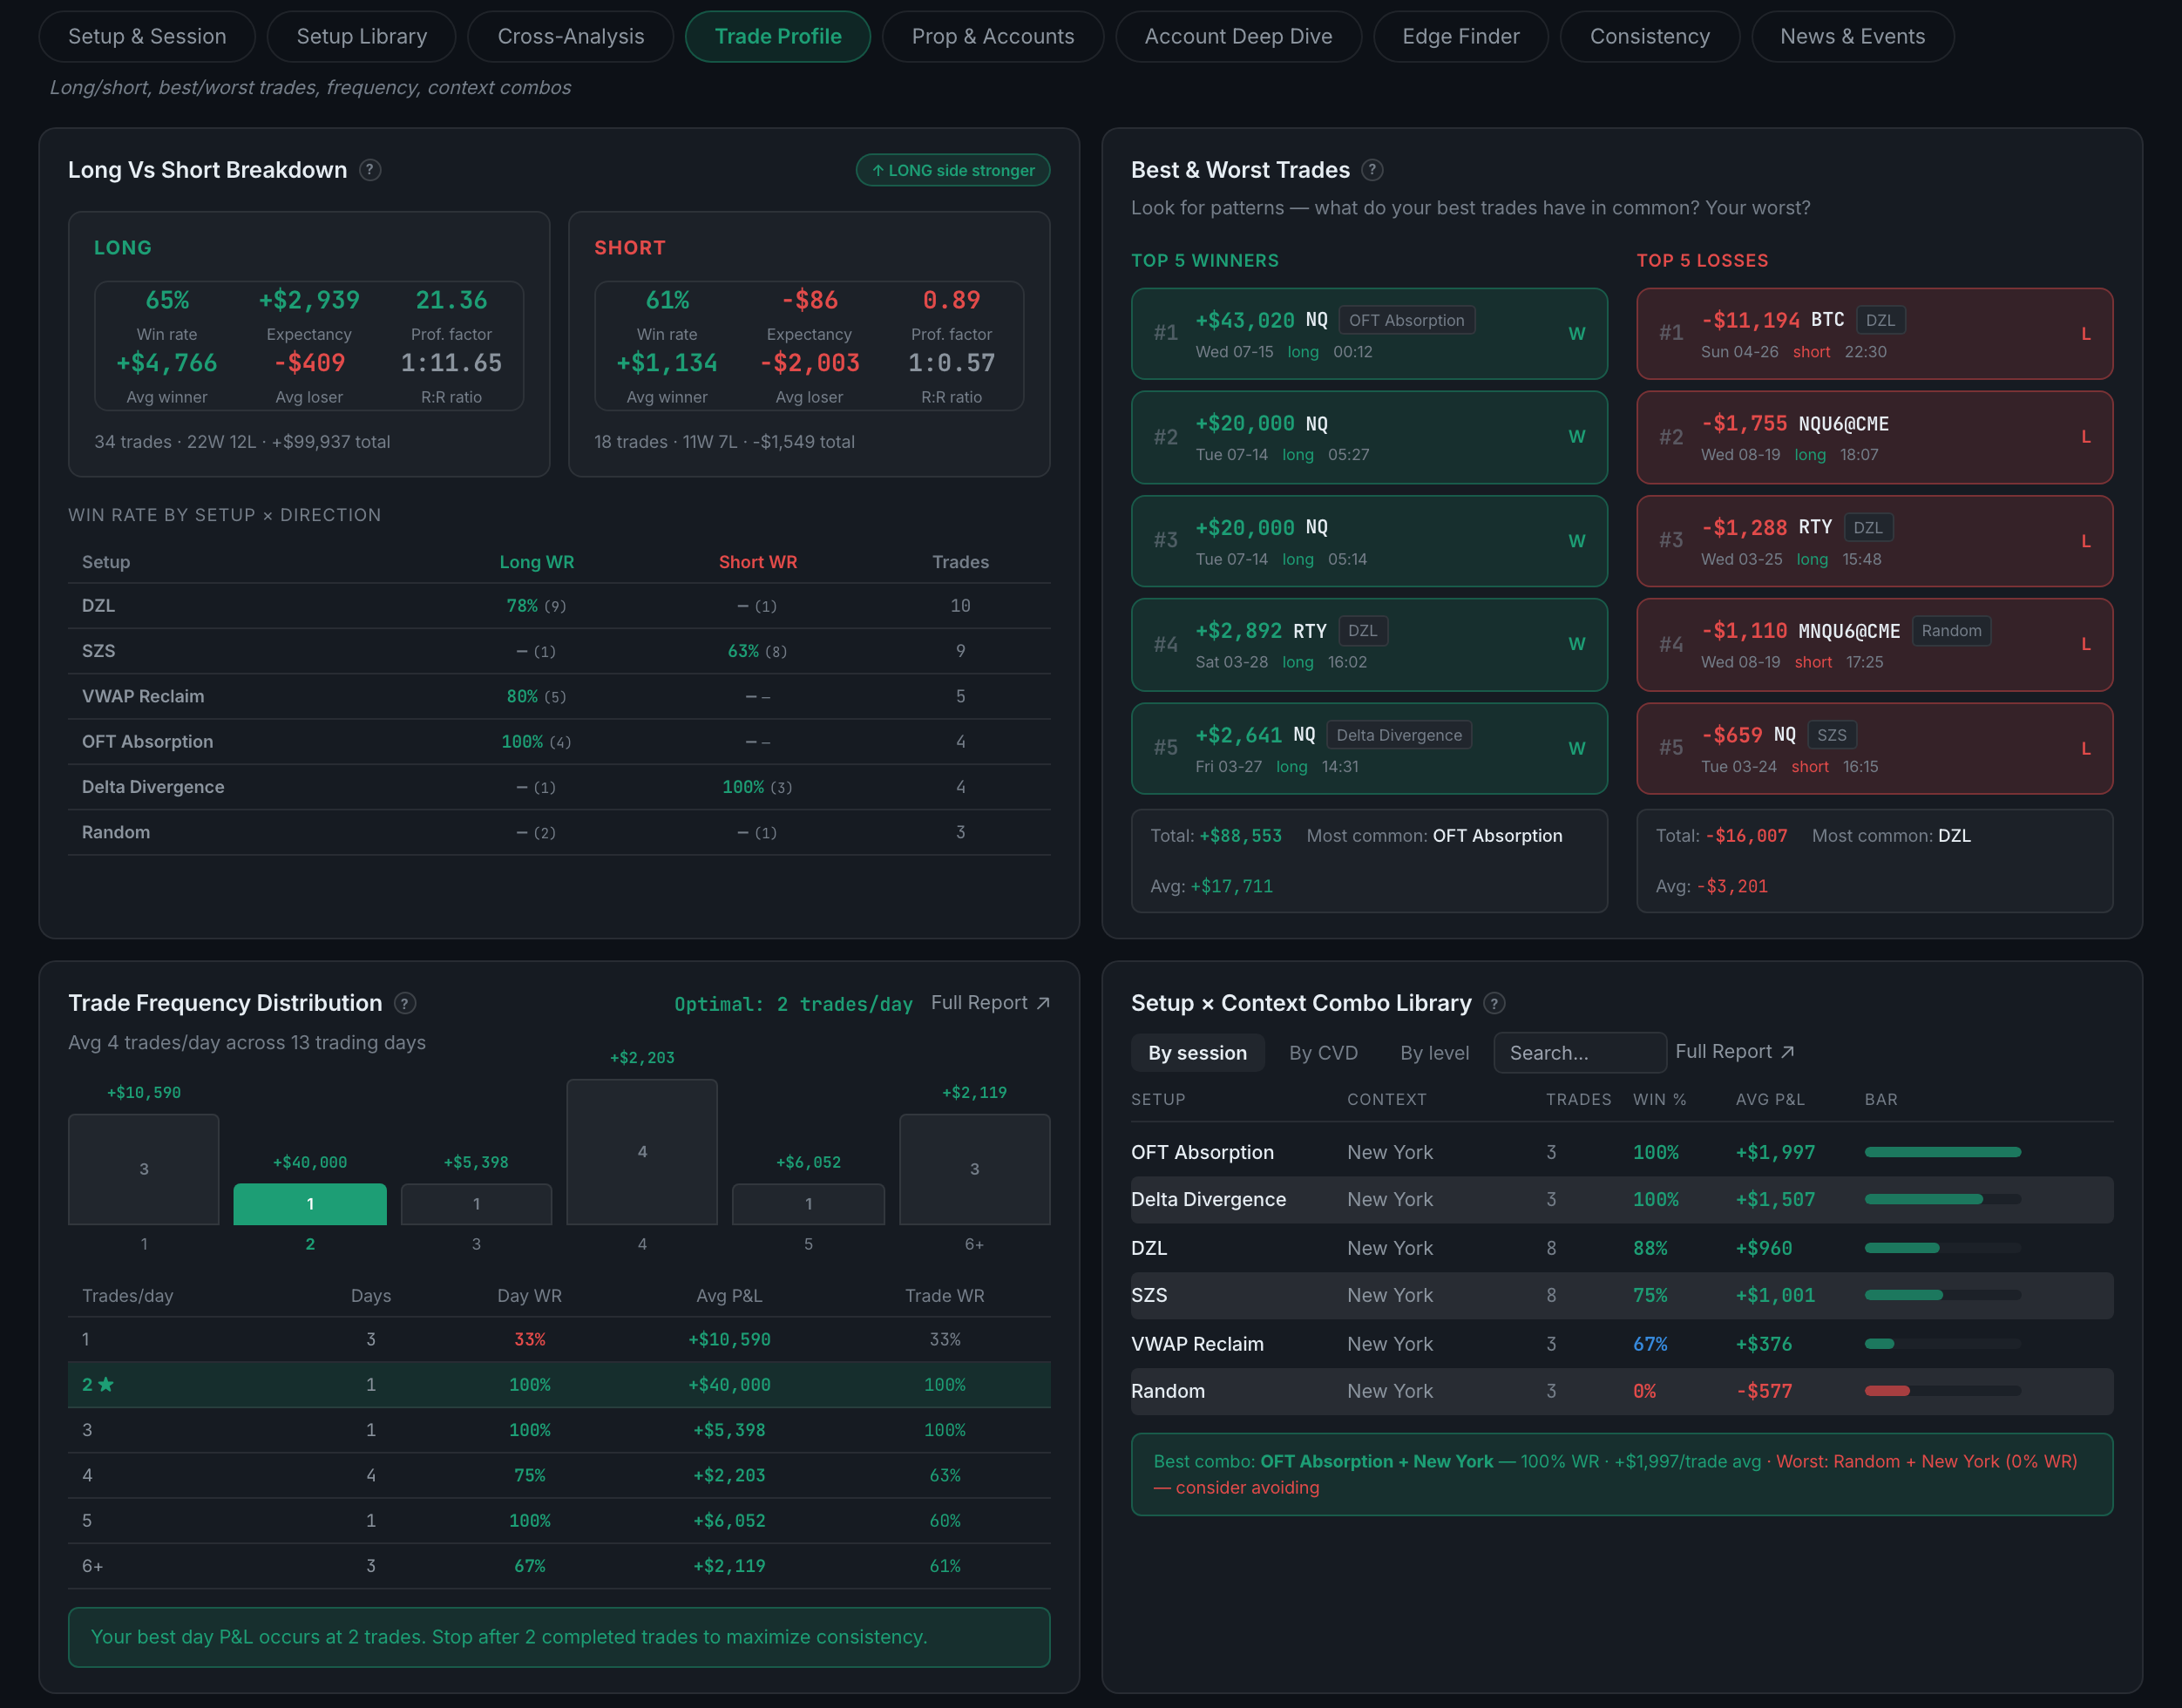
What is on the Trade Profile sub-page?
The shape of how you trade — long against short, your five best and five worst trades, how often you trade, and which context combinations keep recurring.
Less about which setup wins and more about what your trading looks like from a distance. It is the sub-page that catches asymmetries you would never think to look for, of which long-versus-short is by far the most common.
Indicators on this sub-page:
- Long vs Short BreakdownWin rate, expectancy, profit factor, average winner, average loser and R:R for each direction side by side, with trade counts and totals, and a badge naming the stronger side. Under it, win rate by setup × direction — each setup's long win rate against its short win rate. A large gap usually means one direction is being traded on a different plan from the other, and this table is where the plan gets found.
- Best & Worst TradesYour top five winners and top five losses, each with its instrument, setup tag, direction, date and time, plus the totals, the averages, and the setup that appears most often in each column. That last line is the one to read: if the same setup heads both lists, it is a sizing problem rather than a setup problem.
- Trade Frequency DistributionDays grouped by how many trades you took, with day win rate, average P&L and trade win rate for each, your optimal count starred, and a plain instruction at the foot: your best day P&L occurs at N trades, so stop after N. Needs five trades across three trading days.
- Setup × Context Combo LibraryEvery setup paired with a context, with trades, win rate and average P&L. The context dimension is switchable — by session, by CVD or by level — and there is a search box. It closes by naming your best combo and the one to avoid.