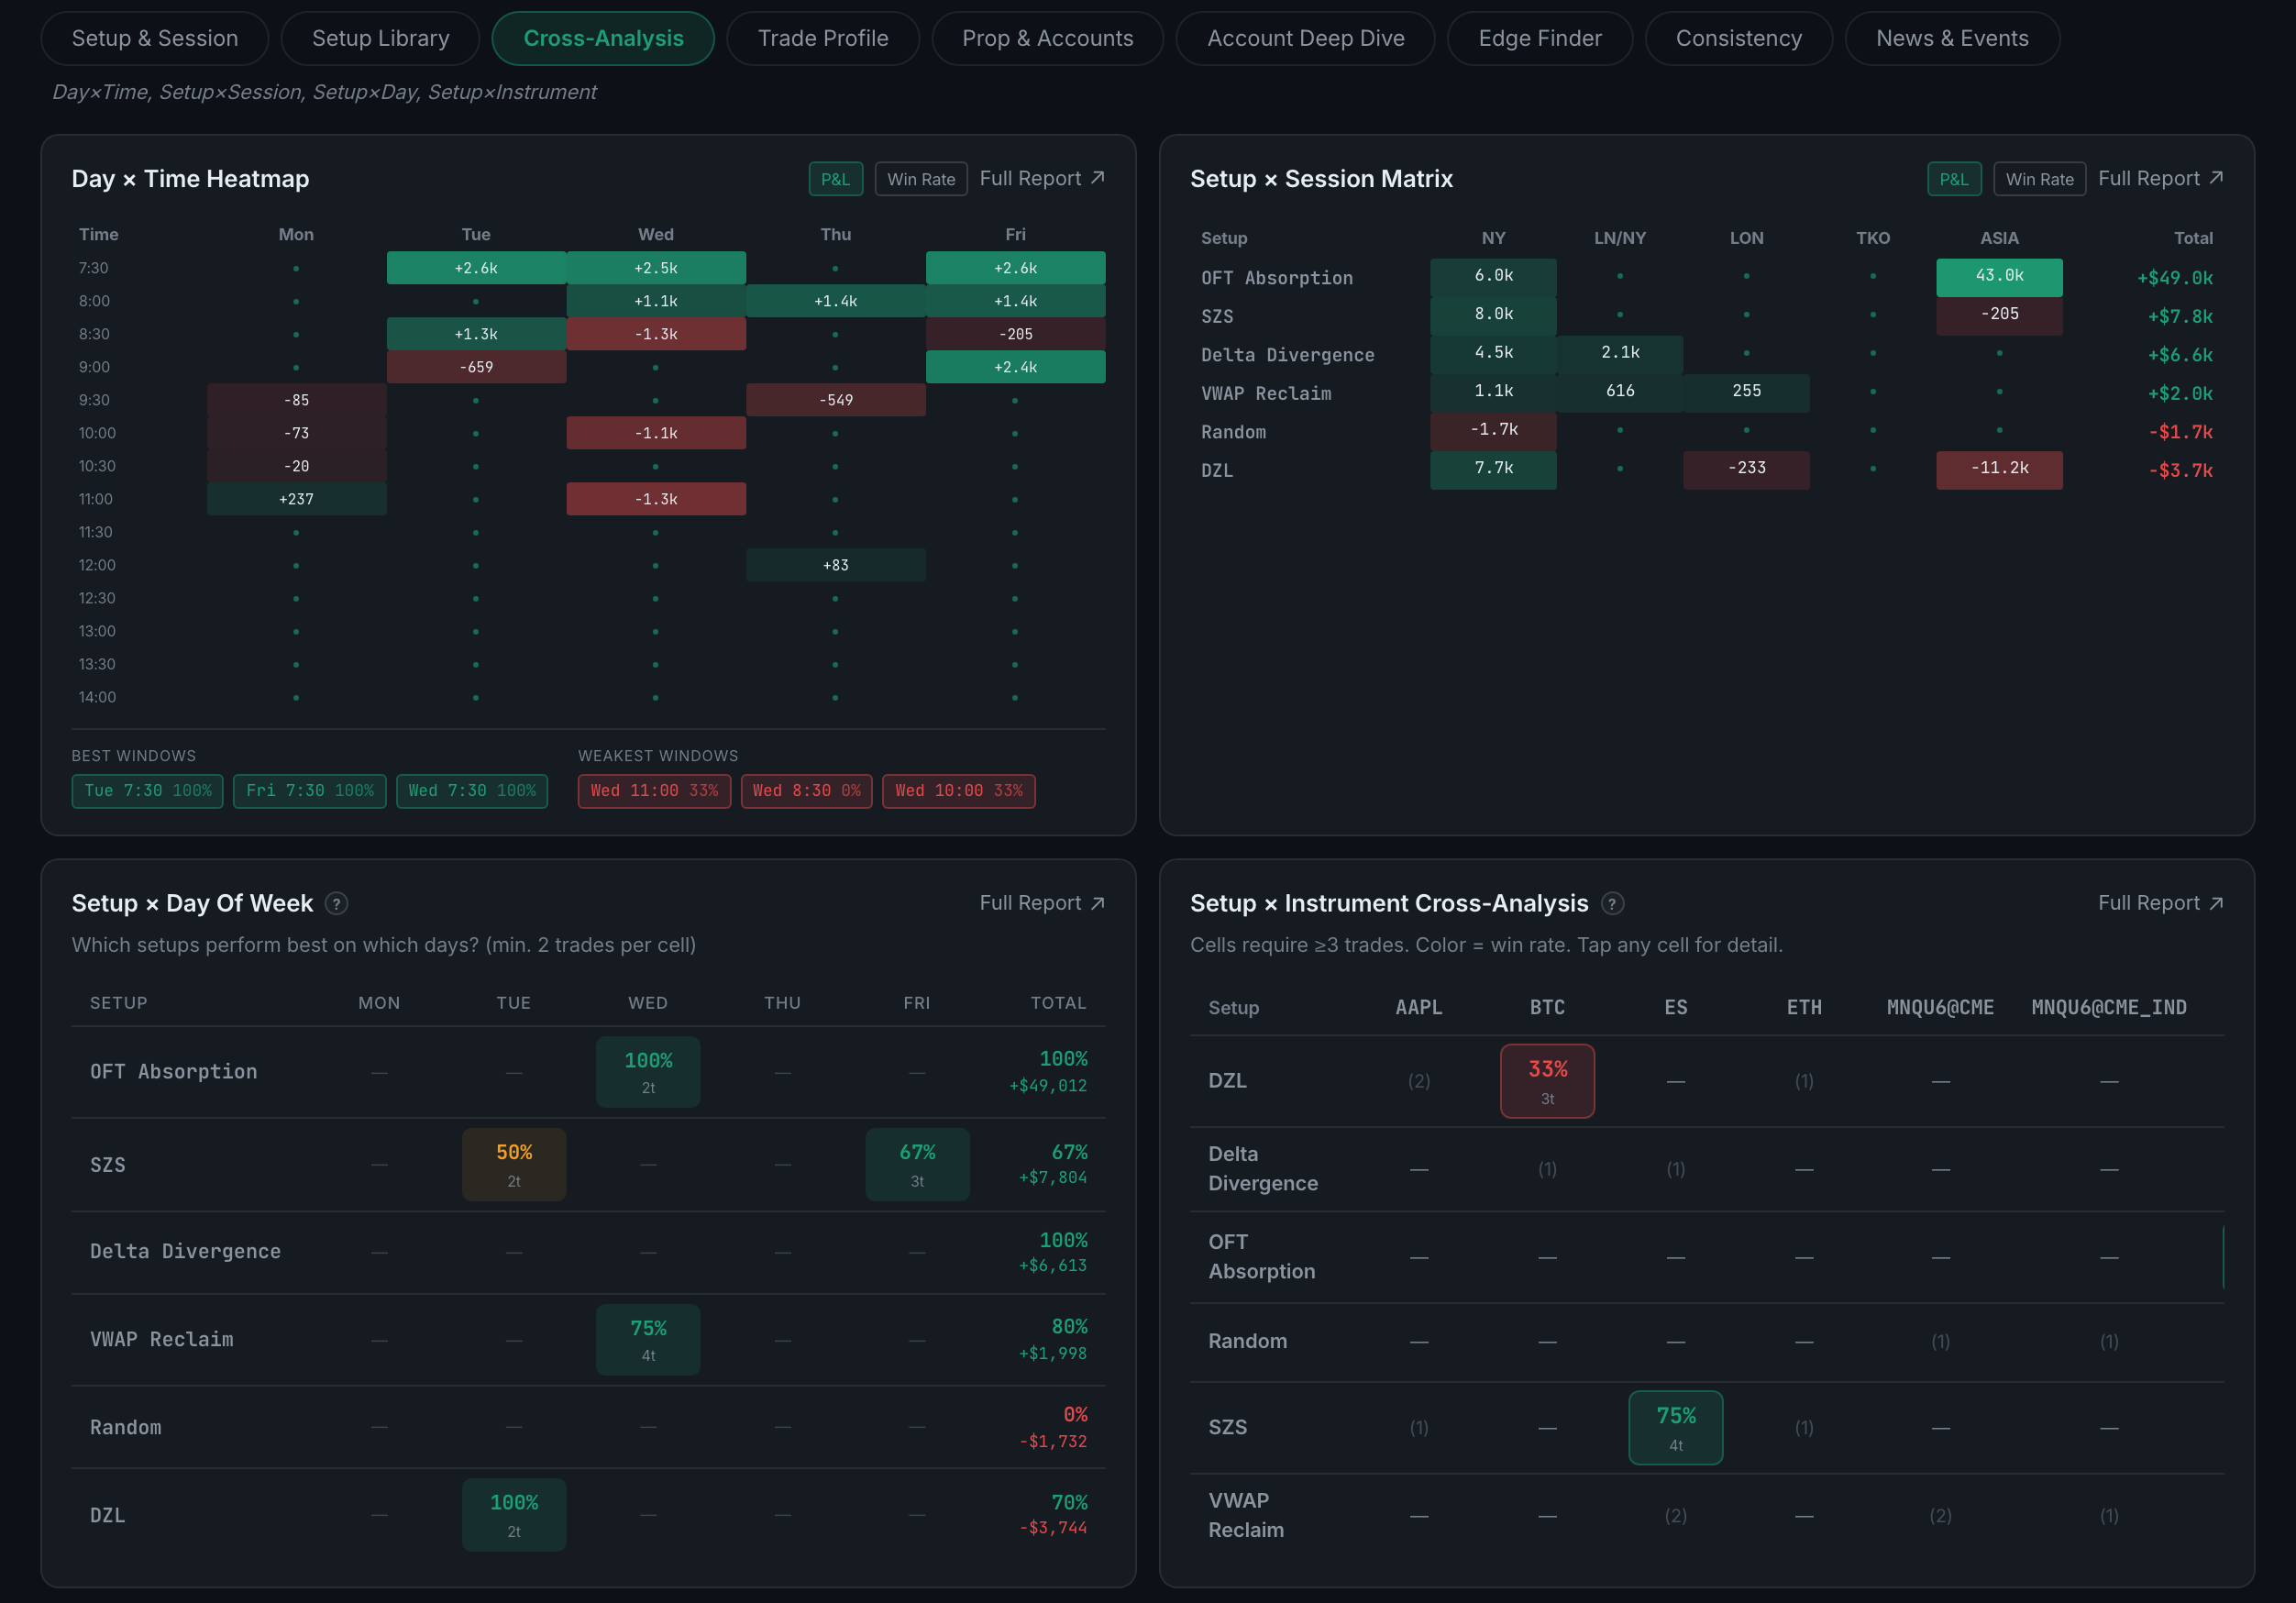
What is on the Cross-Analysis sub-page?
Four matrices that take two dimensions at once — day × time, setup × session, setup × day of week, and setup × instrument.
This is where combinations show up that neither dimension reveals on its own. A setup that looks average overall and a session that looks average overall can be excellent together, and no single-dimension ranking will ever tell you.
Indicators on this sub-page:
- Day × Time HeatmapThe trading week as a grid of half-hour slots, coloured by result, with best windows and weakest windows named as chips underneath so you do not have to hunt for the darkest square yourself.
- Setup × Session MatrixEach setup against NY, LN/NY, LON, TKO and Asia, with a total per setup on the right.
- Setup × Day of WeekEach setup against each weekday, showing win rate and trade count per cell. Minimum two trades per cell.
- Setup × Instrument Cross-AnalysisEach setup against each instrument, coloured by win rate. Minimum three trades per cell; cells under that show their count in brackets rather than a colour, so a one-trade fluke never reads as a finding.
The first two carry a P&L / Win Rate toggle in their header — the same grid told two ways, and they can disagree. A cell that is green on P&L and red on win rate is one big winner carrying a lot of losers.
All four have their own Full Report, listing the top five best and worst cells. The whole sub-page needs at least two setups and two instruments with three or more trades per cell before it will build at all.