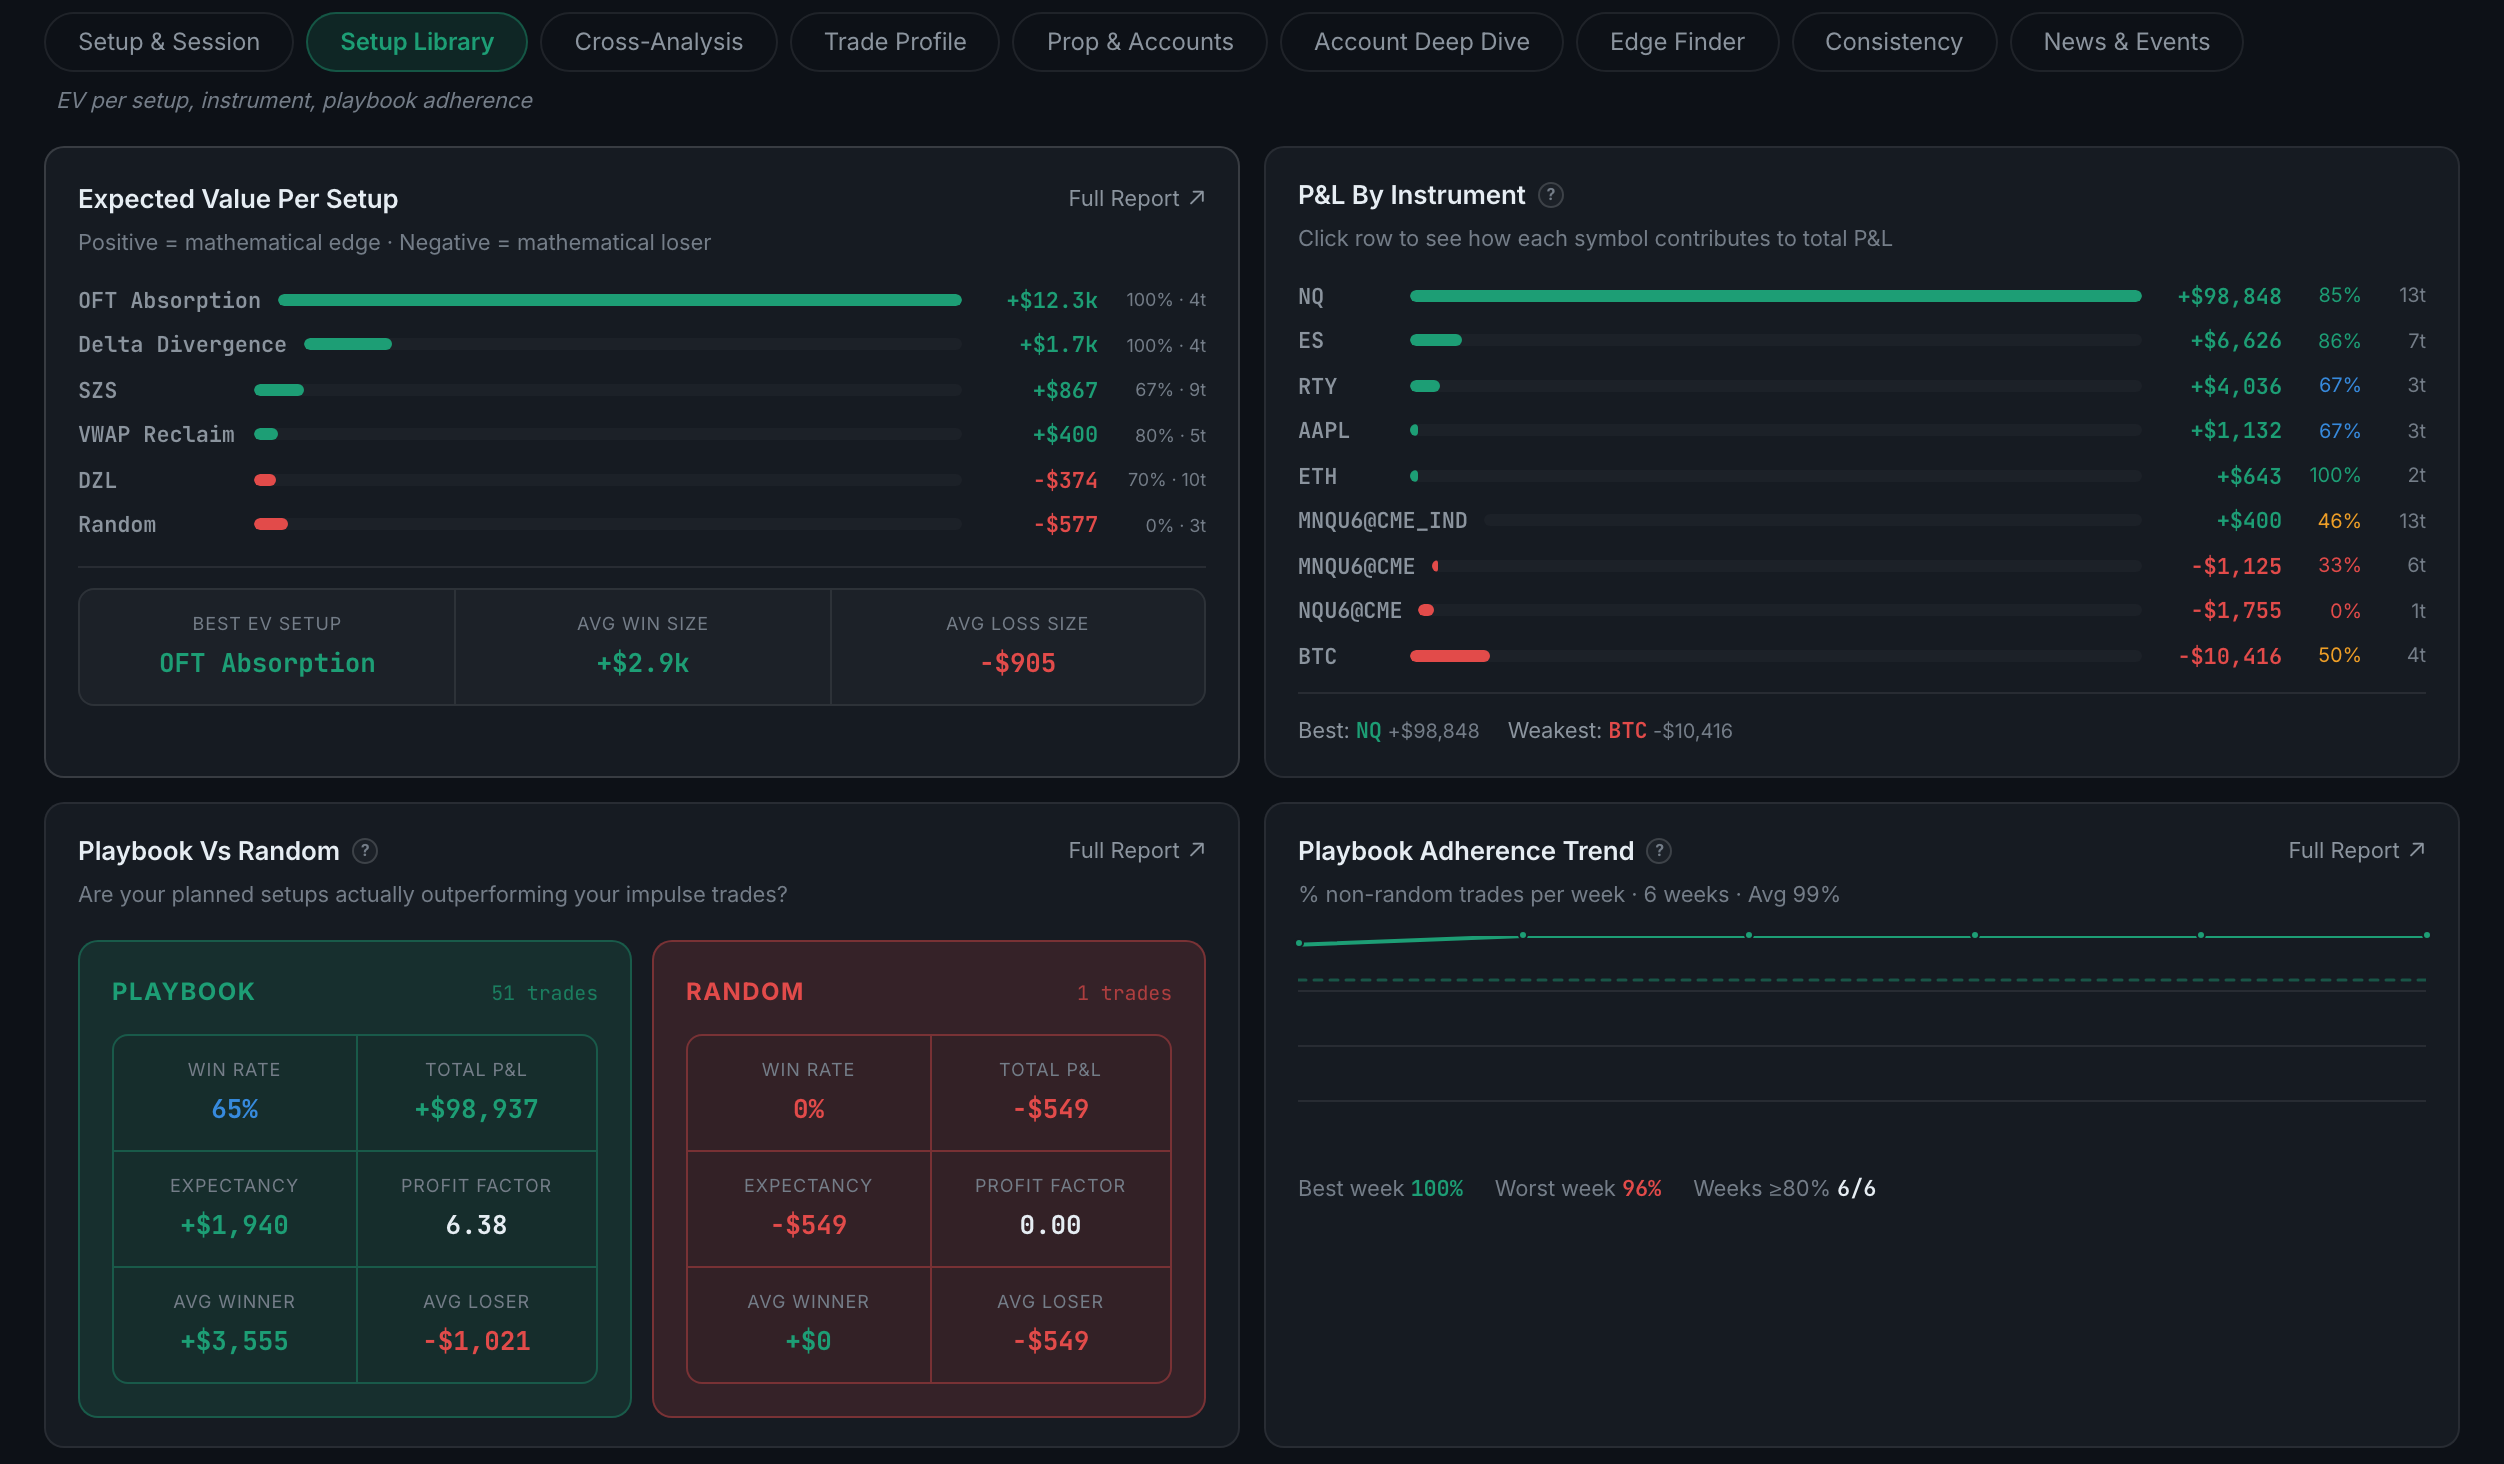
What is on the Setup Library sub-page?
Expected value per setup and per instrument, and the honest test of whether your playbook is doing anything — your playbook trades measured against your off-book ones.
Setup & Session tells you which setup made the most money. This sub-page asks the harder question: which setup makes the most money per trade, and would you have done just as well without the rules.
Indicators on this sub-page:
- Expected Value Per SetupEV per trade for each setup with its win rate and trade count, so a rarely-taken setup with a strong edge is not buried under a common mediocre one. Positive is a mathematical edge and negative is a mathematical loser, stated in exactly those words. Below it, your best EV setup, average win size and average loss size.
- P&L by InstrumentEvery symbol you have traded with its total, win rate and trade count, and your best and weakest named underneath. Click a row to see how that symbol contributes to the total.
- Playbook vs RandomTwo cards side by side, playbook and random, each with trade count, win rate, total P&L, expectancy, profit factor, average winner and average loser. Its Full Report adds the gap figures and a verdict, and the verdict is willing to tell you your playbook is filtering out your edge rather than protecting it.
- Playbook Adherence TrendThe share of non-random trades per week, plotted, with your best week, worst week and how many weeks cleared 80%. Needs three weeks of data before it will plot.