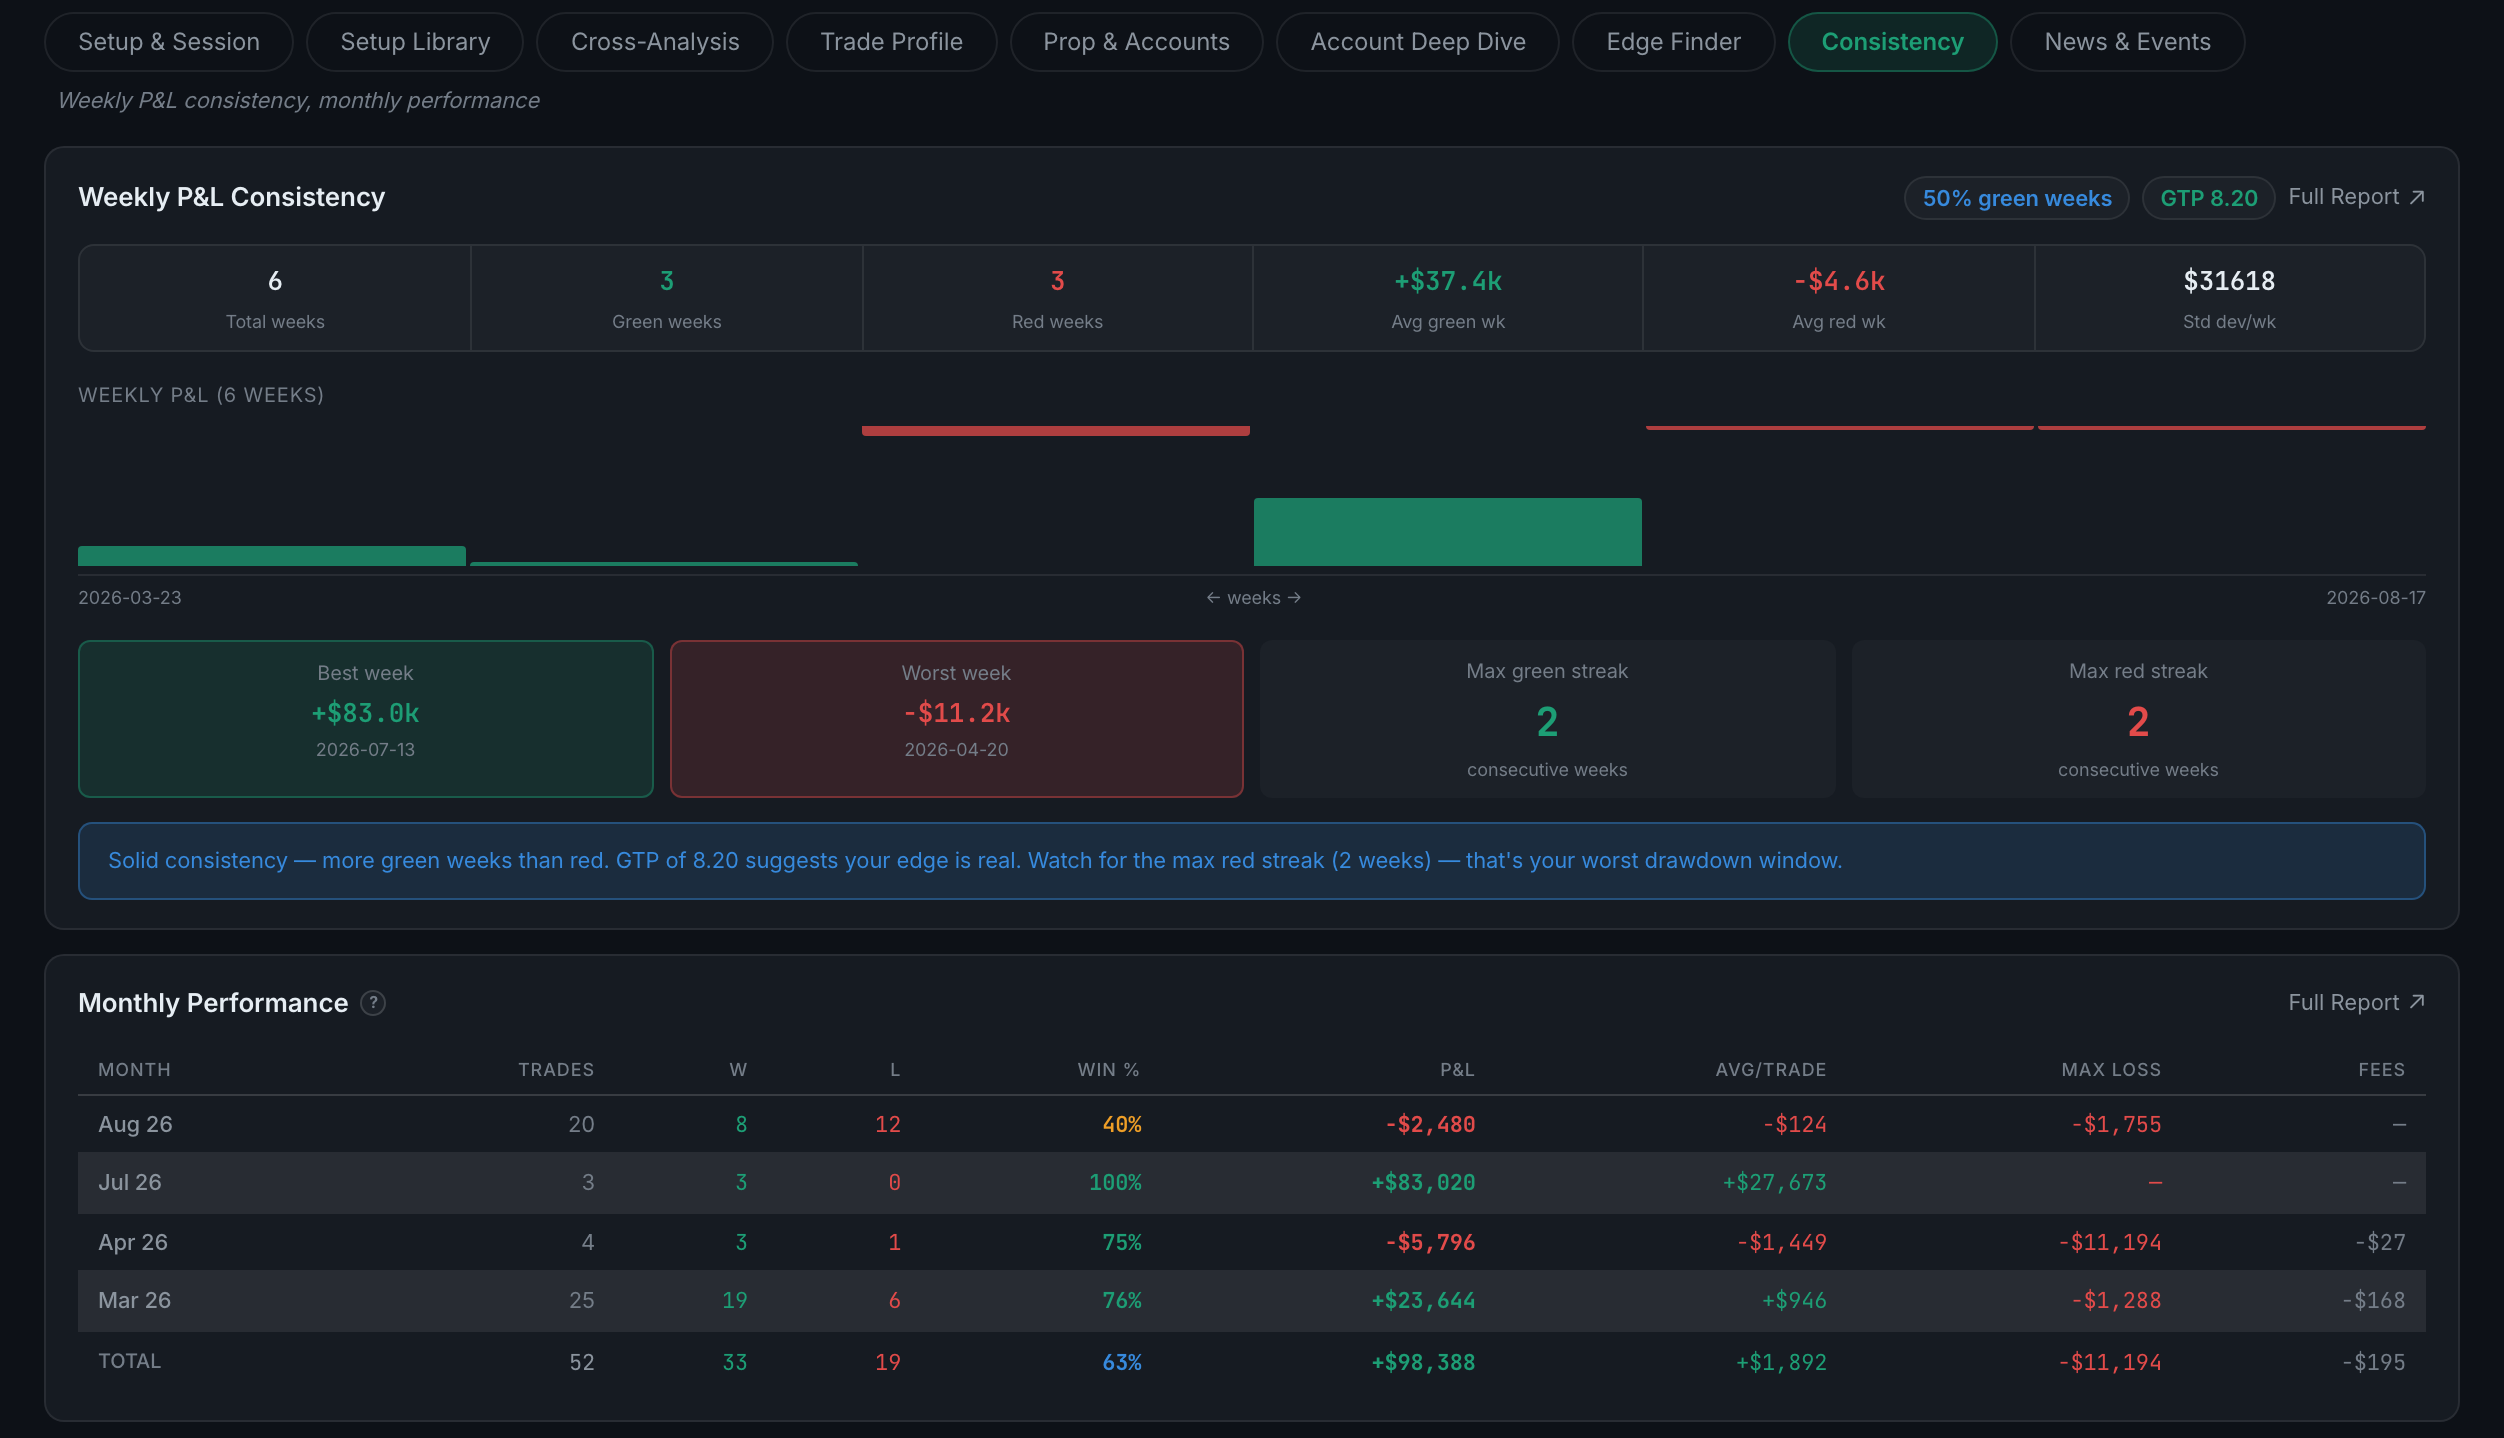
What is on the Consistency sub-page?
Whether your P&L arrives steadily or in lumps — weekly consistency and monthly performance.
Two accounts can end the quarter on the same number, one by grinding and one by catching a single enormous day. Prop firms care about the difference, and so should you, because only one of those is repeatable.
Indicators on this sub-page:
- Weekly P&L ConsistencyTotal weeks, green weeks, red weeks, your average green week, your average red week and the standard deviation between them; then the weeks as bars, your best and worst week with their dates, and your longest green and red streaks in consecutive weeks. Two badges sit in the header: the share of green weeks, and GTP — gain-to-pain. It closes with a reading that names your max red streak as your worst drawdown window, which is the sentence a prop trader should copy down.
- Monthly PerformanceA row per month: trades, wins, losses, win percentage, P&L, average per trade, largest loss and fees, with a total row at the foot. This is the closest thing in Analytics to a plain statement of account.
The gap between your best week and your average is the number to watch. A best week many times the size of your average is a concentration risk rather than a strength, and the Concentration & Distribution sub-page on Risk puts a score on exactly that.