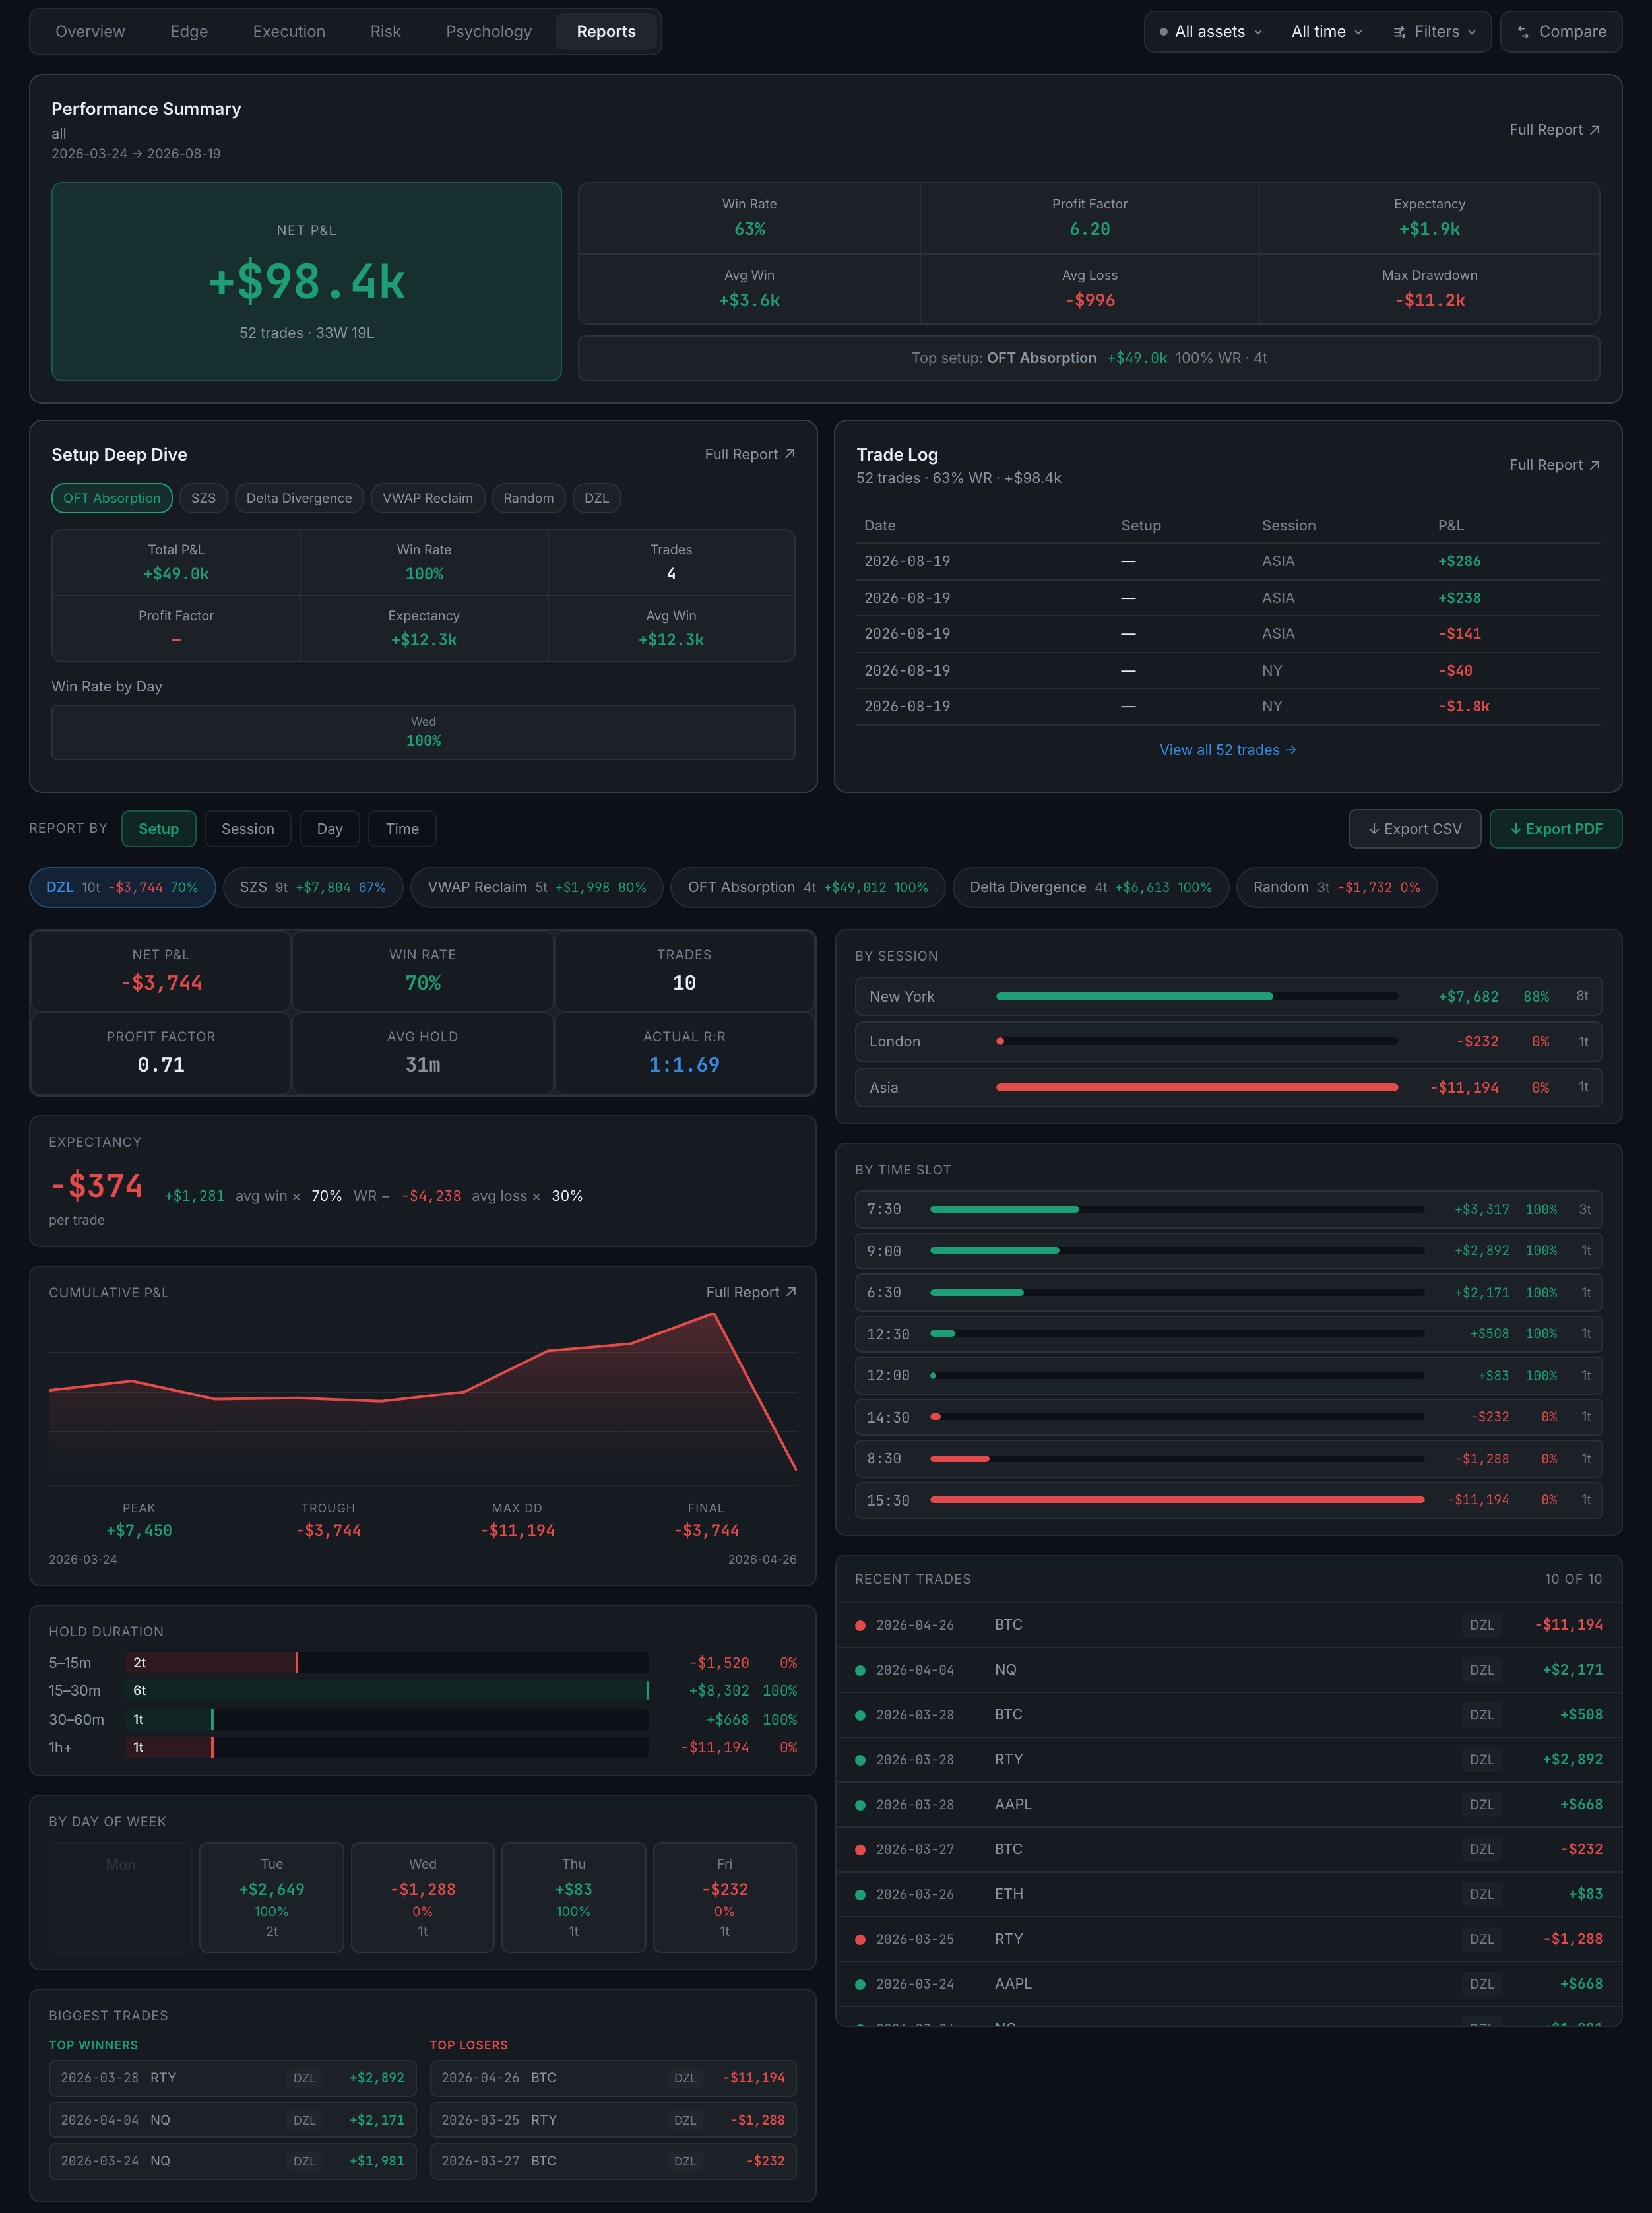
What is on the Reports tab?
Four panels — a performance summary, a per-setup deep dive, your trade log, and a report builder that will slice your record by setup, session, day or time — plus CSV and PDF export.
Reports is the only tab with no sub-page strip: everything is on one screen. It is also the tab that faces outward. The other five help you work out what is going on; this one produces something you can hand to a prop firm, an accountant, or yourself in six months.
The four panels, top to bottom:
- Performance SummaryThe date range it covers stated explicitly, then net P&L as a large figure with the trade count and win/loss split under it, and beside that win rate, profit factor, expectancy, average win, average loss and max drawdown. Your top setup is named across the foot with its P&L, win rate and trade count.
- Setup Deep DiveA row of chips, one per setup. Pick one and the panel rebuilds for it alone: total P&L, win rate, trades, profit factor, expectancy, average win, and win rate by day of week. Profit factor shows a dash rather than a number when a setup has no losses yet — that is not a missing figure, it is a division with nothing to divide by.
- Trade LogYour most recent trades as a table of date, setup, session and P&L, with the totals in the header and View all 52 trades → to open the rest.
- Report byThe report builder, covered separately below.
All three of the first panels carry their own Full Report ↗.