How do I draw on a chart image?
Open the image on the Snapshot tab and use the markup toolbar — nine tools and six colours, drawn on a layer above the image so the original is never altered.
Marking up is how a screenshot becomes a note to your future self. A clean chart six months later tells you very little; the same chart with the level you were watching circled and "waited for the retest, never came" typed beside it tells you everything.
The drawing sits on a separate layer over the image. Your original screenshot is untouched underneath, so you can rework annotations freely.
The tools are:
- Select / MovePick an existing mark to reposition, resize, or delete it
- PenFreehand
- HighlighterA thick translucent stroke for shading a zone
- Line and Arrow — straight marks, arrows for pointing at a level
- Rectangle and Oval — for boxing a range or circling a candle
- Text boxType directly onto the chart
- EraserRemove marks
Six colours are available: red, green, amber, blue, white and black, and three stroke widths sit beside them. The habit worth forming is using colour consistently — red for what went wrong, green for what you would do instead — so your annotations become scannable rather than decorative.
The overlay does one more thing that is easy to miss. Down the right-hand side is an Edit Context panel with two boxes, What happened and What I'd do differently. These are the same two fields as the Notes tab — they sync with it and with your daily debrief. So you can mark the chart up and write the lesson in one place, while looking at the picture, rather than annotating and then hunting for the Notes tab.
Step by step
- Go to the Snapshot tab and move your pointer over the image you want to mark up. A small Annotate button appears over it — it is hidden until you hover, so it is easy to miss.
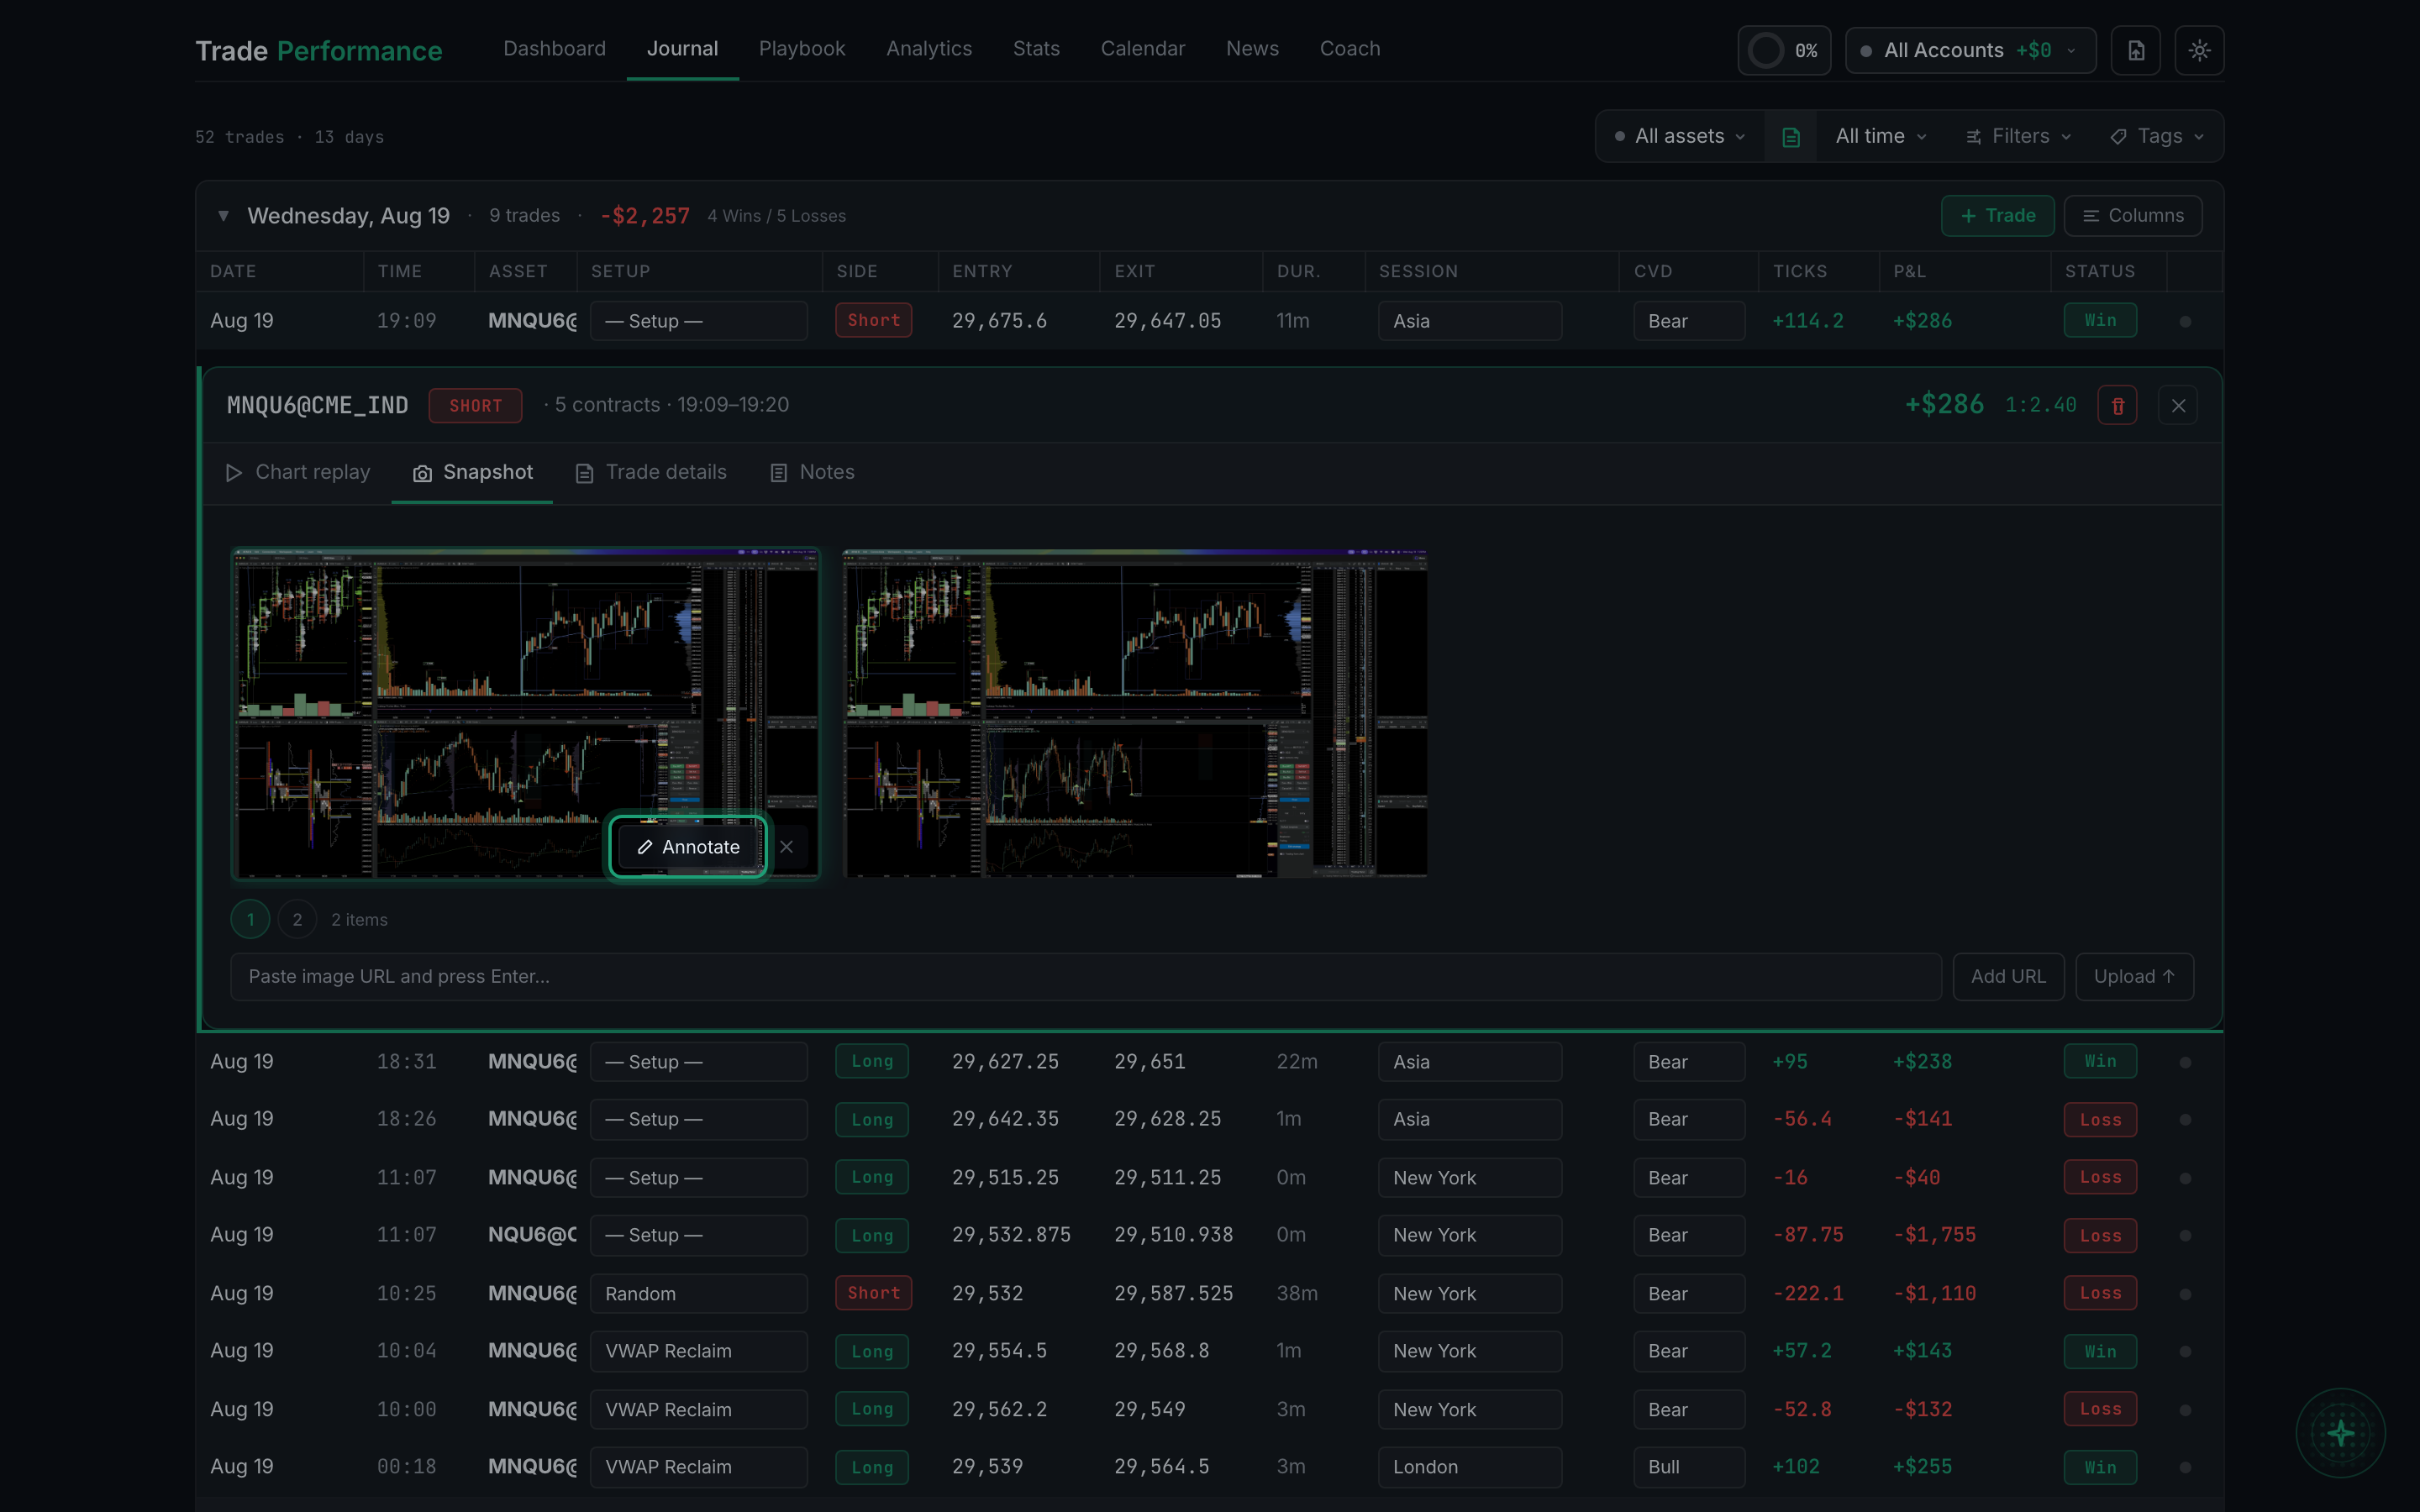
the Annotate button revealed by hovering over a chart image - Click Annotate. The image opens with a markup toolbar.
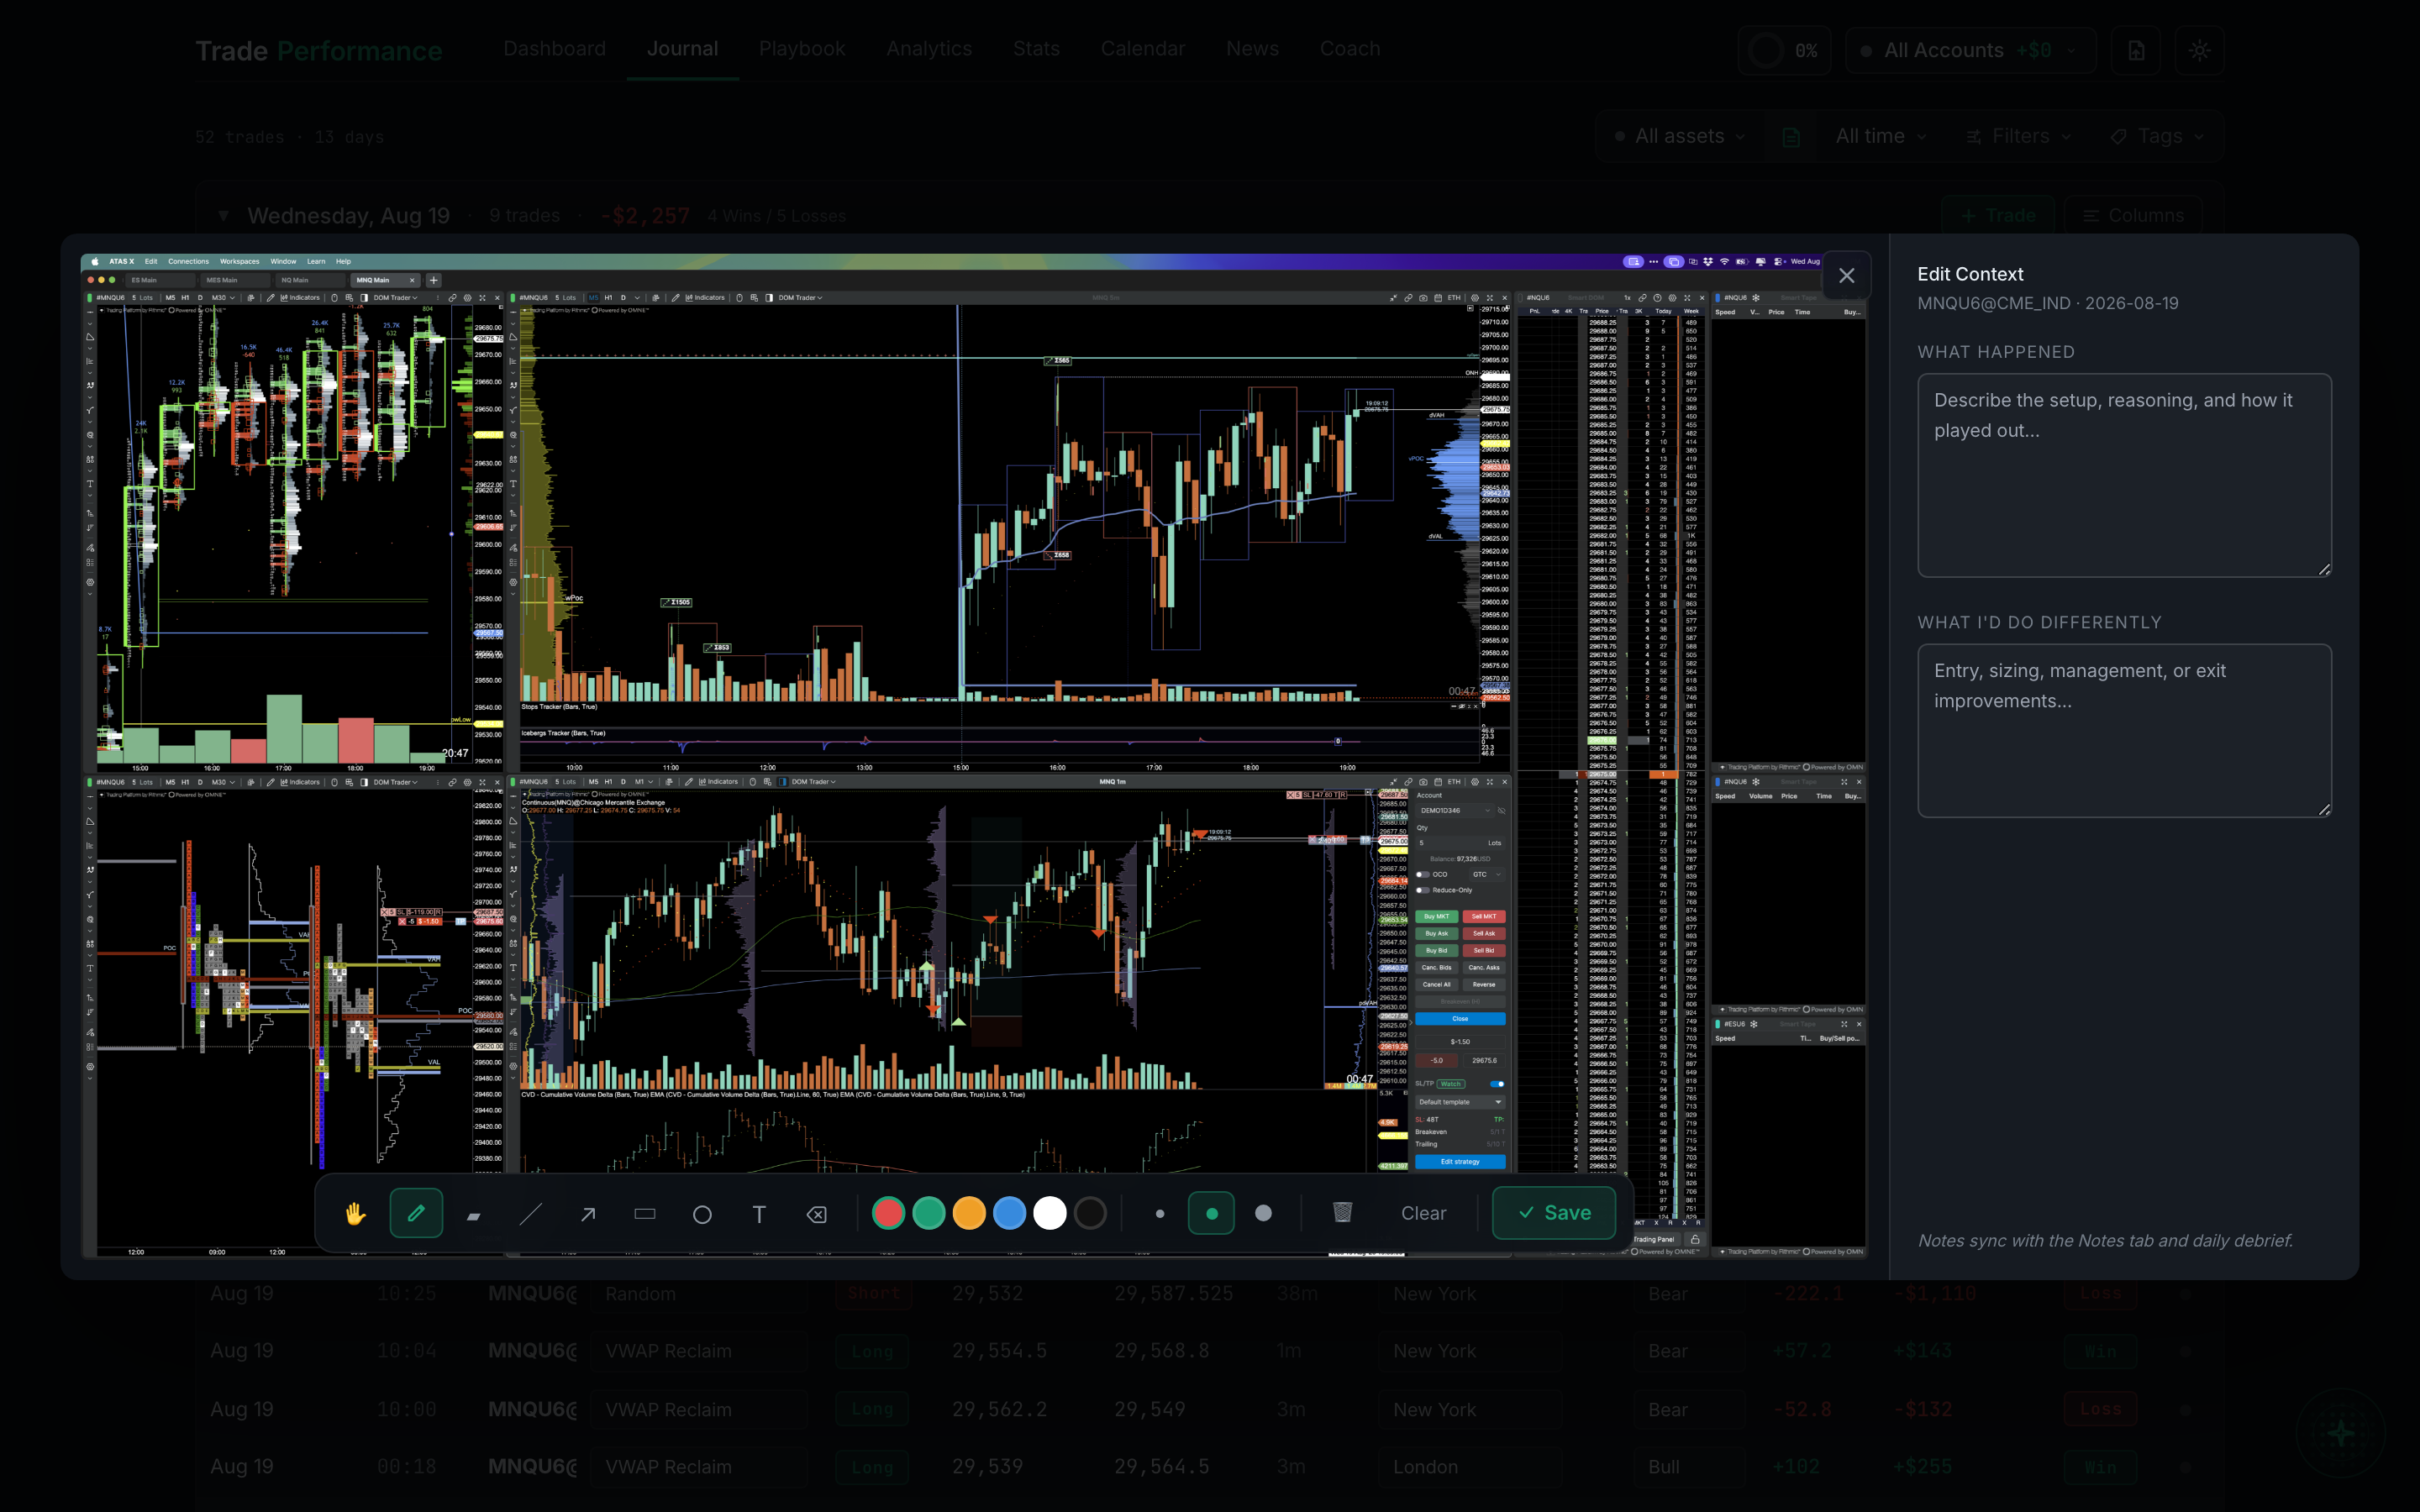
the markup toolbar showing the nine tools and the colour swatches - Pick a tool, then pick a colour and a stroke width, and draw on the image.
- To change something, switch to Select / Move — the hand icon at the left of the toolbar — click the mark, then drag it, drag its handles to resize, or delete it.
- Write the lesson while you are looking at the chart, using What happened and What I'd do differently on the right. Those are the same fields as the Notes tab, so anything you type here shows up there and in the day's debrief.
- Clear wipes every mark on the image and starts you over. Save keeps your work and closes the overlay — the marked-up version is what you will see next time you open the trade.