What does the READ CHART button do?
It reads a chart screenshot you have attached and suggests values for the market context fields, so you do not have to type them.
Filling in CVD bias, VWAP position and order flow by hand for every trade is the kind of chore people abandon after a week, which is how you end up with analytics that cannot tell you anything. This is the shortcut.
It needs two things: an AI key configured in Settings, and an image already attached on the Snapshot tab. There is nothing to read without a picture — if you press it with no image, it will tell you to attach one first.
What comes back are suggestions, not facts. It is reading a picture of a chart and inferring what it sees. Check them before moving on, particularly on unusual layouts. The cleaner and more standard your chart, the better it does.
There is also a setting that runs this automatically whenever you attach your first image, which you can switch off if you would rather trigger it yourself.
Step by step
- Attach a chart image on the Snapshot tab first.
- Switch to Trade details and click READ CHART.
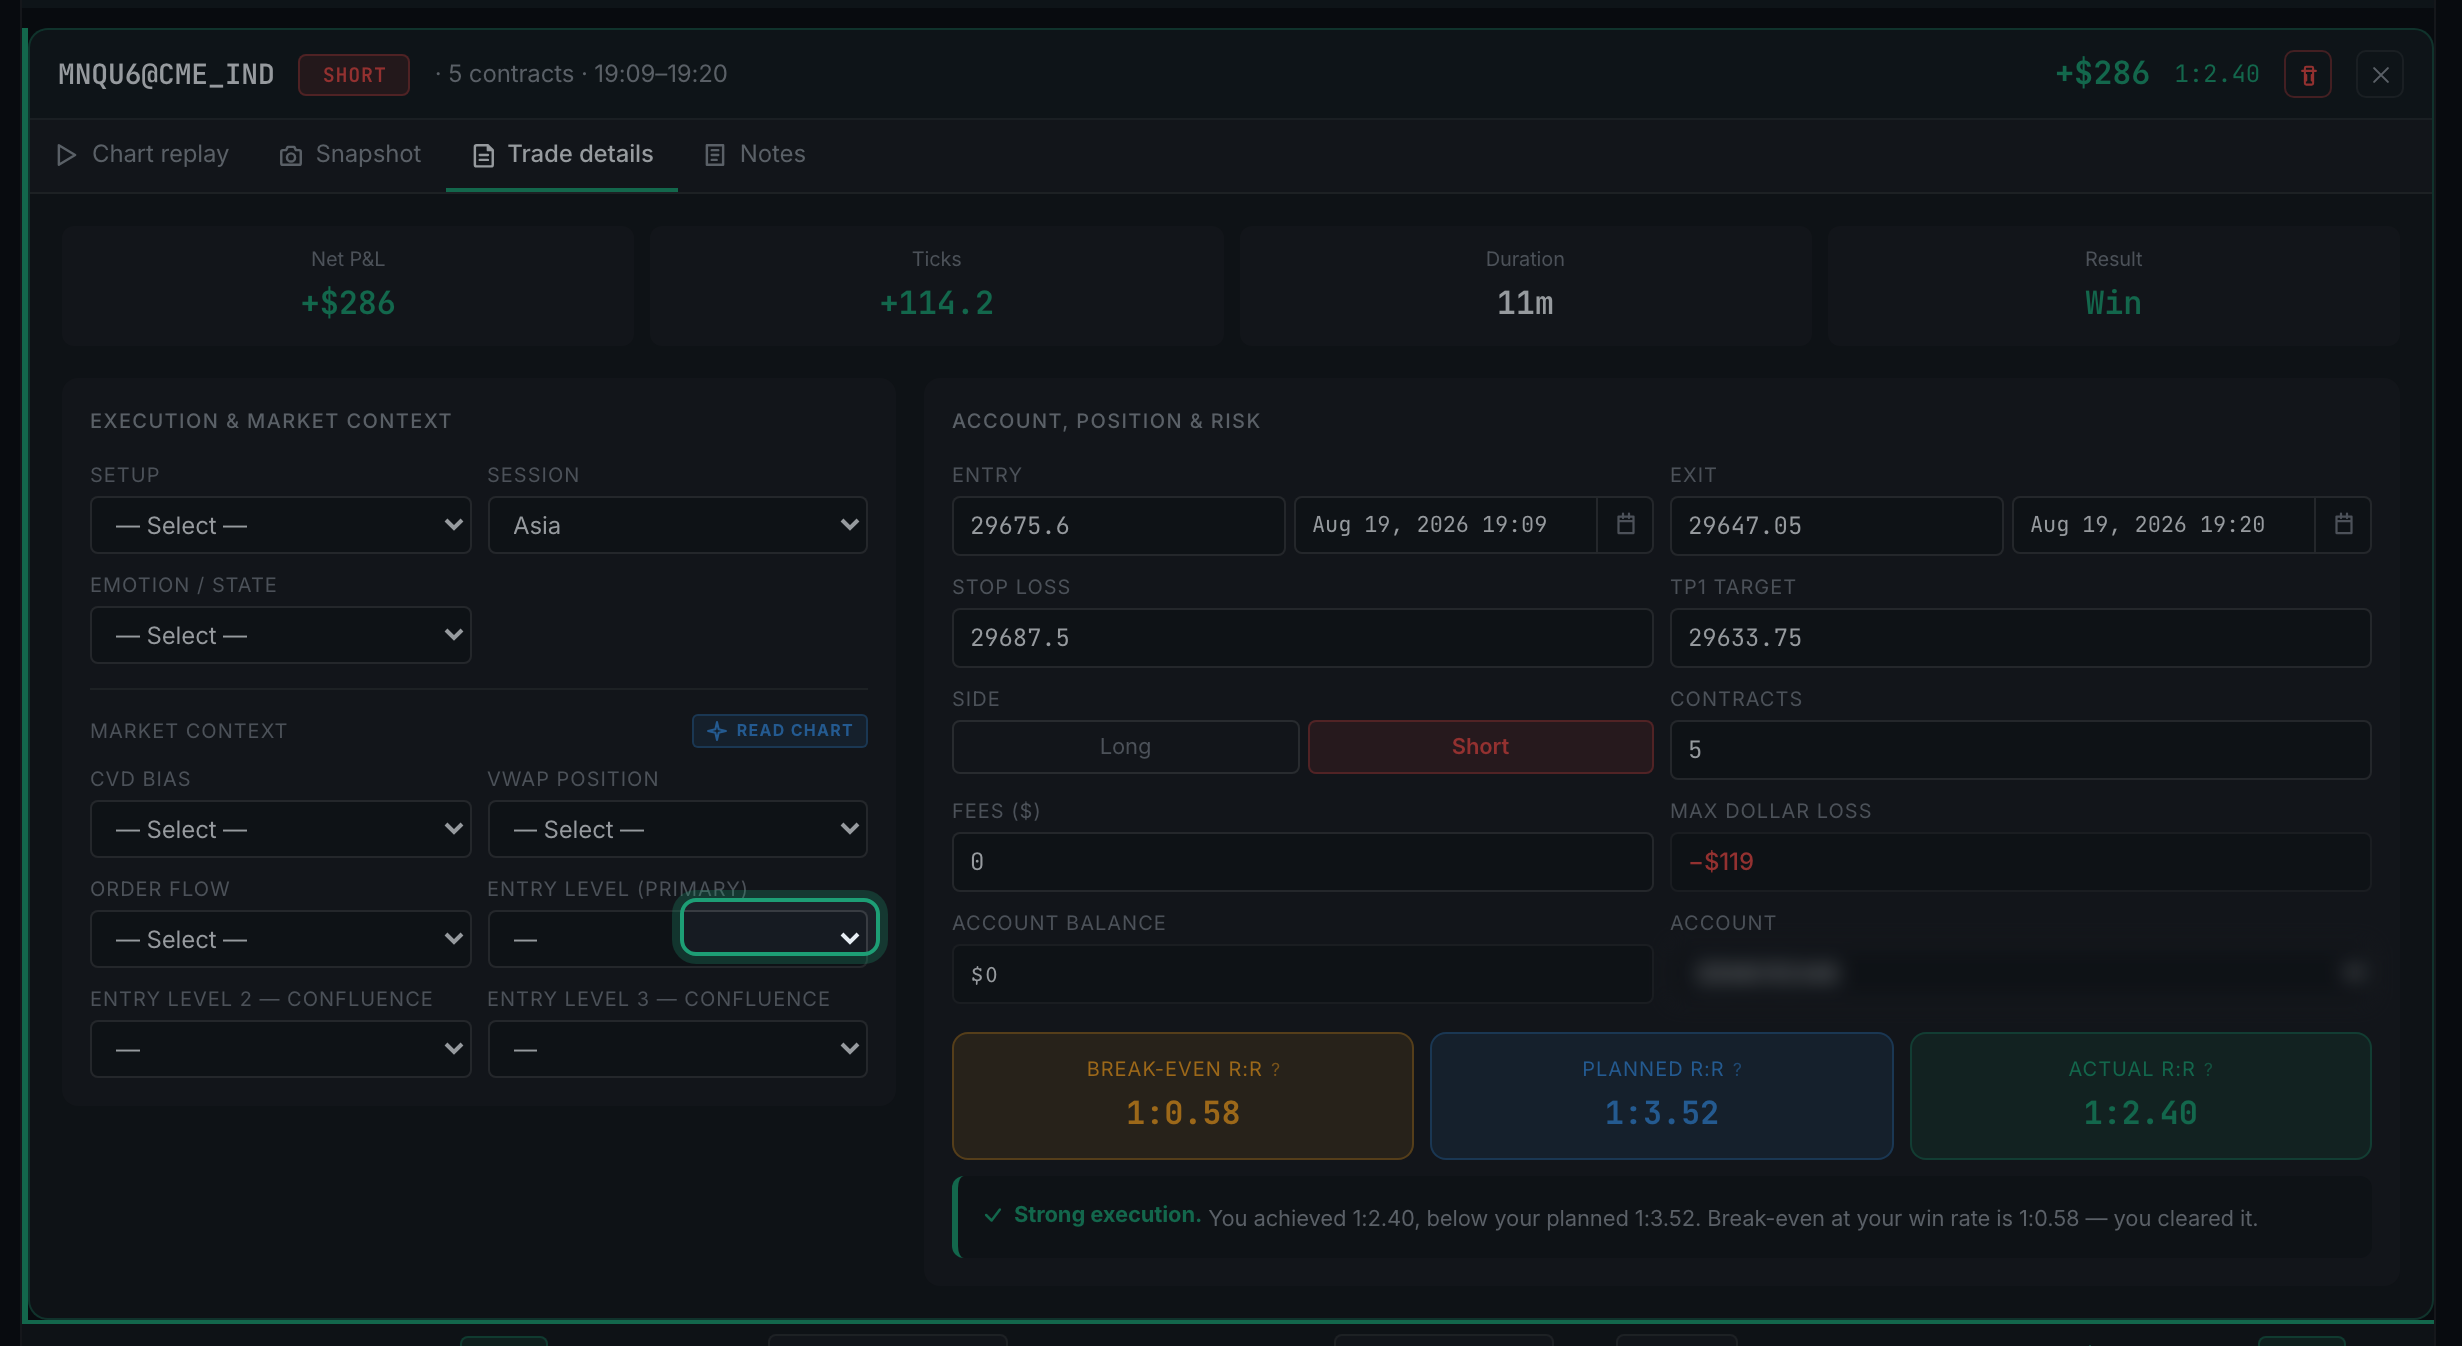
the READ CHART button on the Trade details tab - Wait a moment while it reads the image. A suggestion appears beside each market context field it has an opinion on — CVD bias, VWAP position and Order flow.
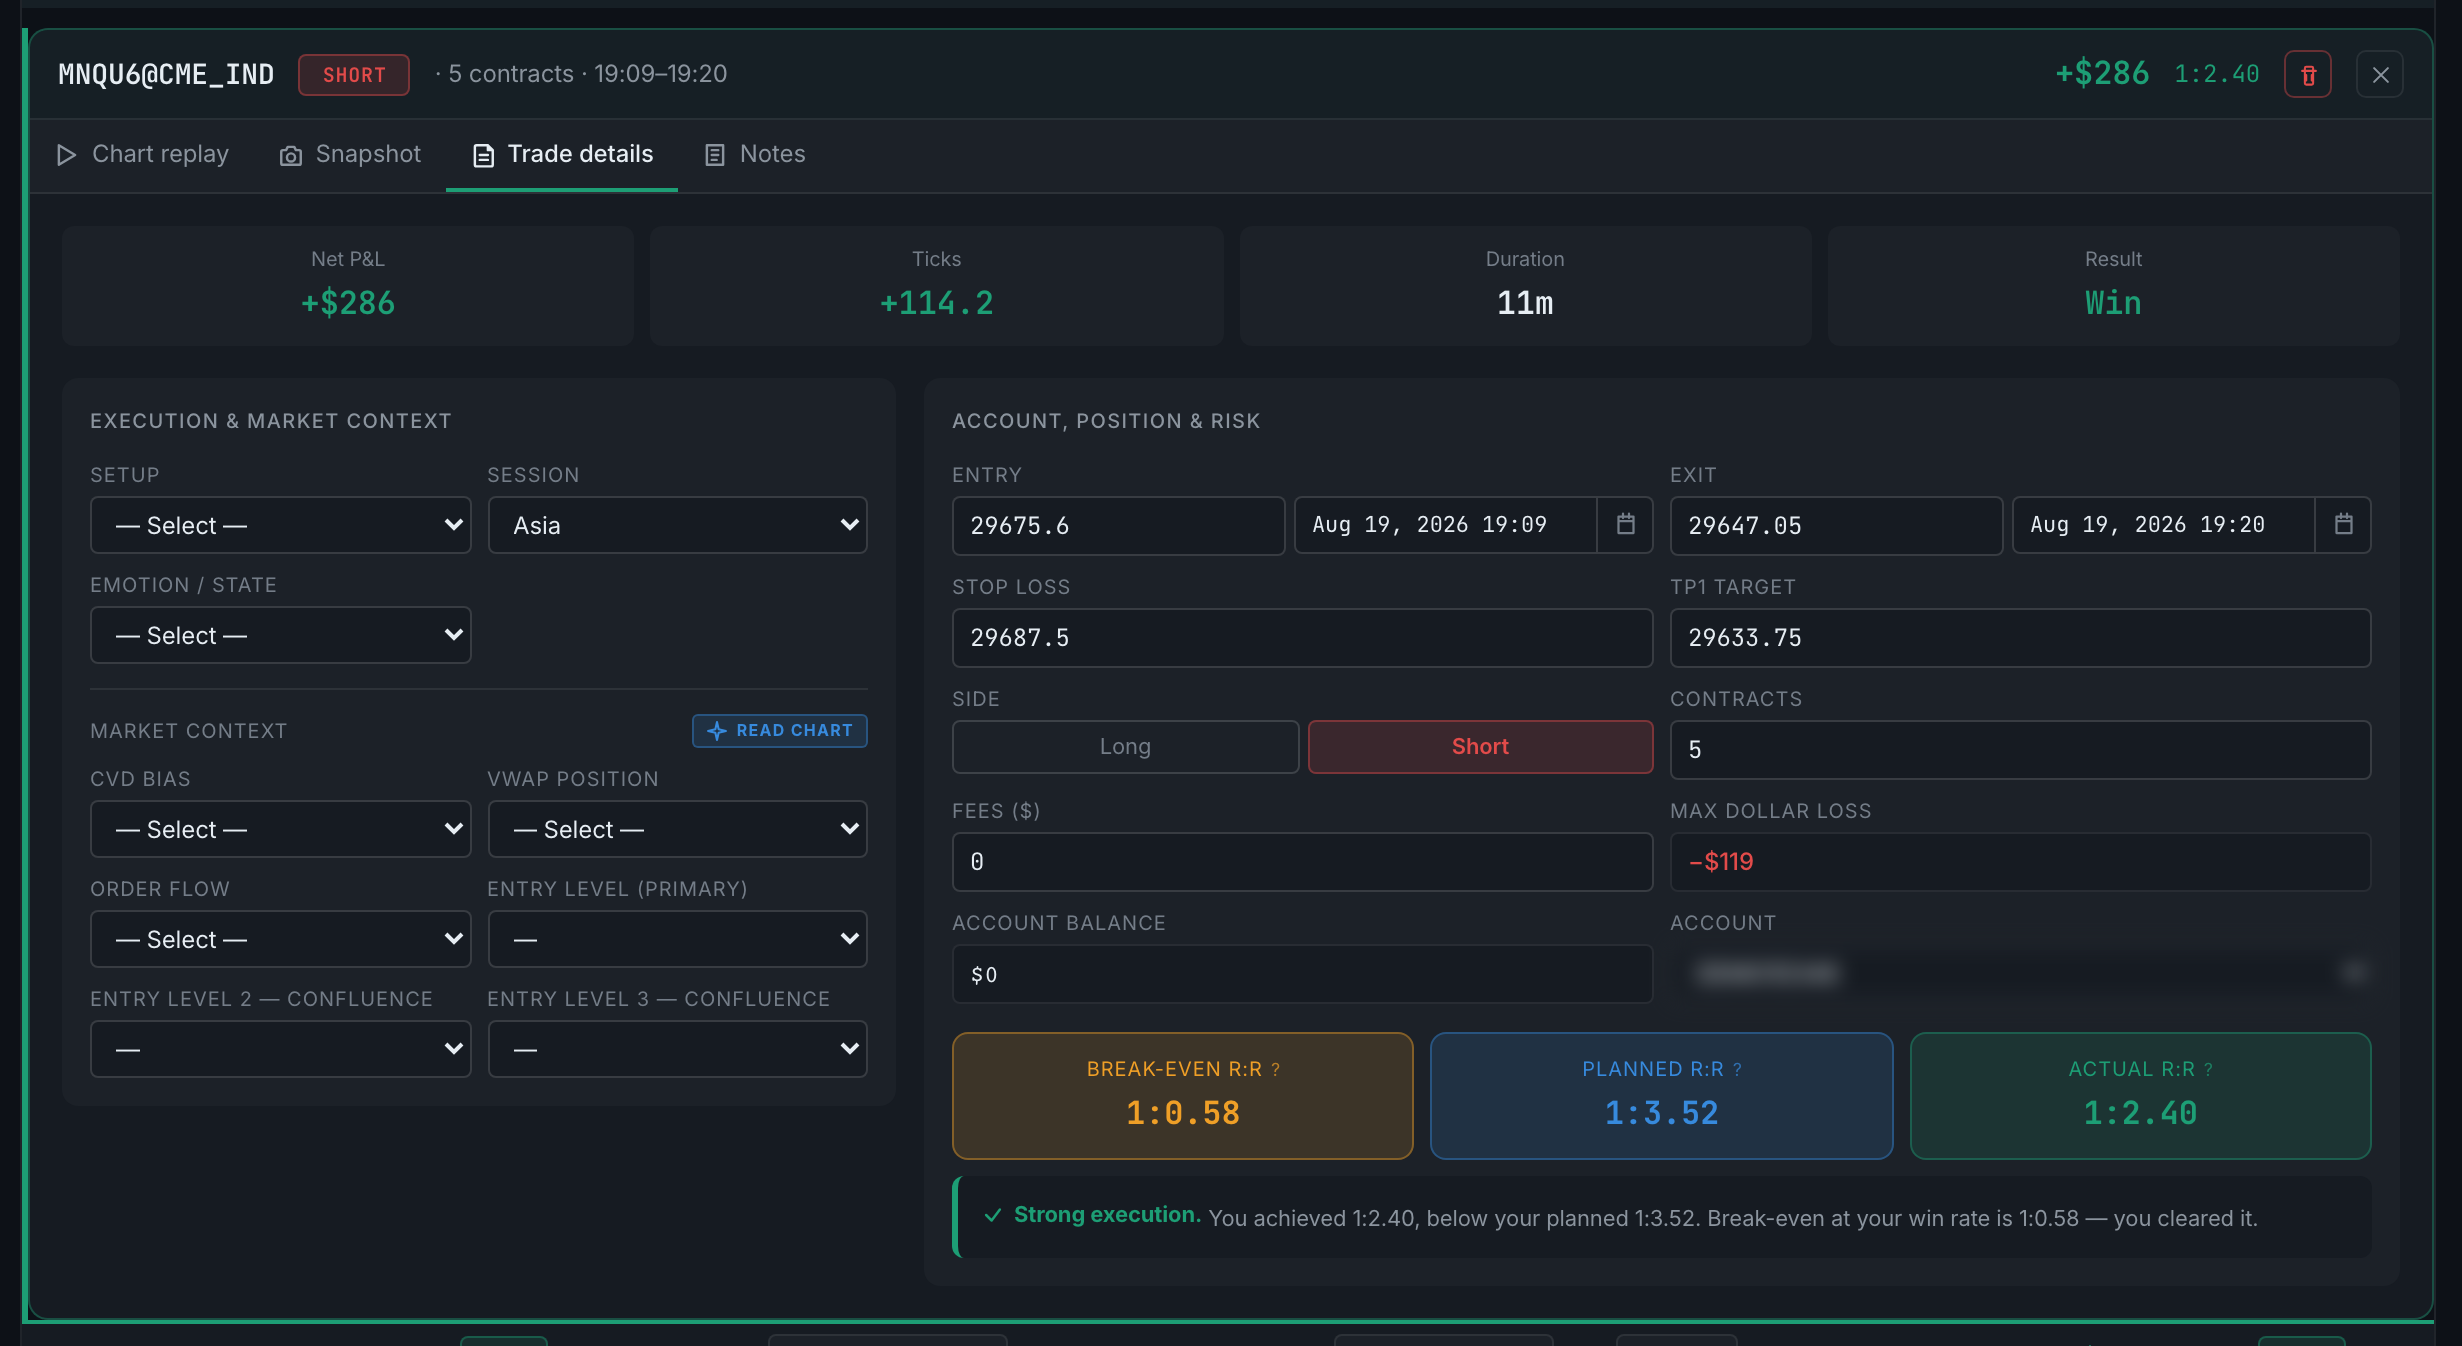
the Market Context fields that READ CHART suggests values for - Take each suggestion or dismiss it. Nothing is written to the trade until you accept it, so a reading you disagree with costs you a click and no more.
If the button says to add an API key first, that is Settings → AI. Without a key it cannot call anything, and pressing it does nothing else.