What is on the Trade details tab?
The numbers and the market context, in two columns — what the market was doing on the left, and your position and risk on the right, including three different risk-to-reward figures.
This tab answers "what actually happened, numerically" and "what was the market doing at the time".
- Left columnExecution and market context: the setup you were trading, the session, how you felt, your CVD bias, VWAP position, order flow read, up to three entry levels, and any custom columns you have created.
- Right columnAccount, position and risk: entry and exit price and time, stop loss, first target, direction, contracts and fees.
This is a place to enter and edit, not only to read. Every field on this tab can be filled in or changed here — which matters because the table on the Journal page lets you edit many of the same fields inline, and the two are the same data seen twice. Change the setup in the table and it changes here; change it here and the table updates. Use whichever is in front of you: the table when you are working across a row, this tab when you are working through one trade properly. See editing a trade without opening it.
The market context fields on the left are the ones the AI chart read tries to fill in for you, and they are what makes the Edge analytics work — an empty market context means Analytics has nothing to group your trades by.
Underneath that sit three risk-to-reward boxes, and the difference between them is the useful part.
- Break-even is the reward-to-risk you need to average, given your current win rate, just to come out flat. It is the bar you have to clear, and it moves as your win rate does.
- Planned is what the trade was set up to make, from your entry, stop and first target.
- Actual is what it really made, based on where you got out.
Reading Planned against Actual is the fastest way to spot a habit. Actual consistently below Planned means you are cutting winners early. Actual worse than your stop implies means you are not honouring stops.
Step by step
- Open a trade and click Trade details.
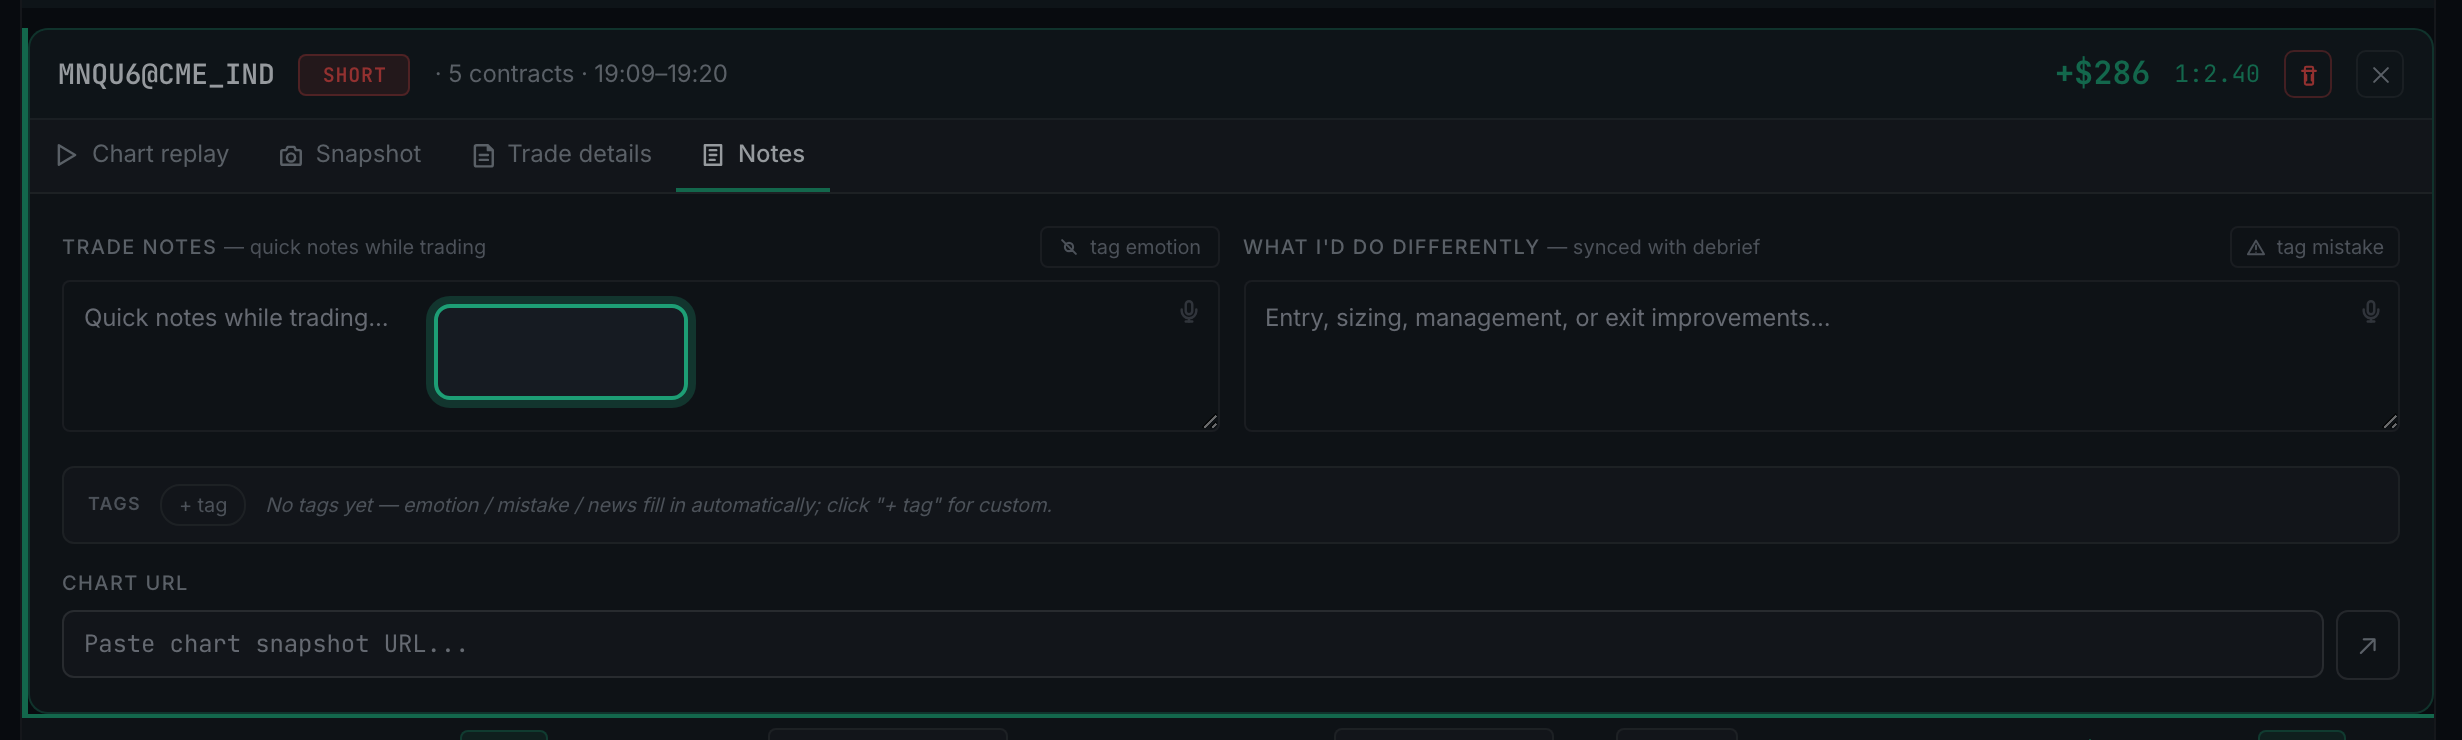
the Trade details tab selected in the detail panel - Fill in or check the market context fields down the left.
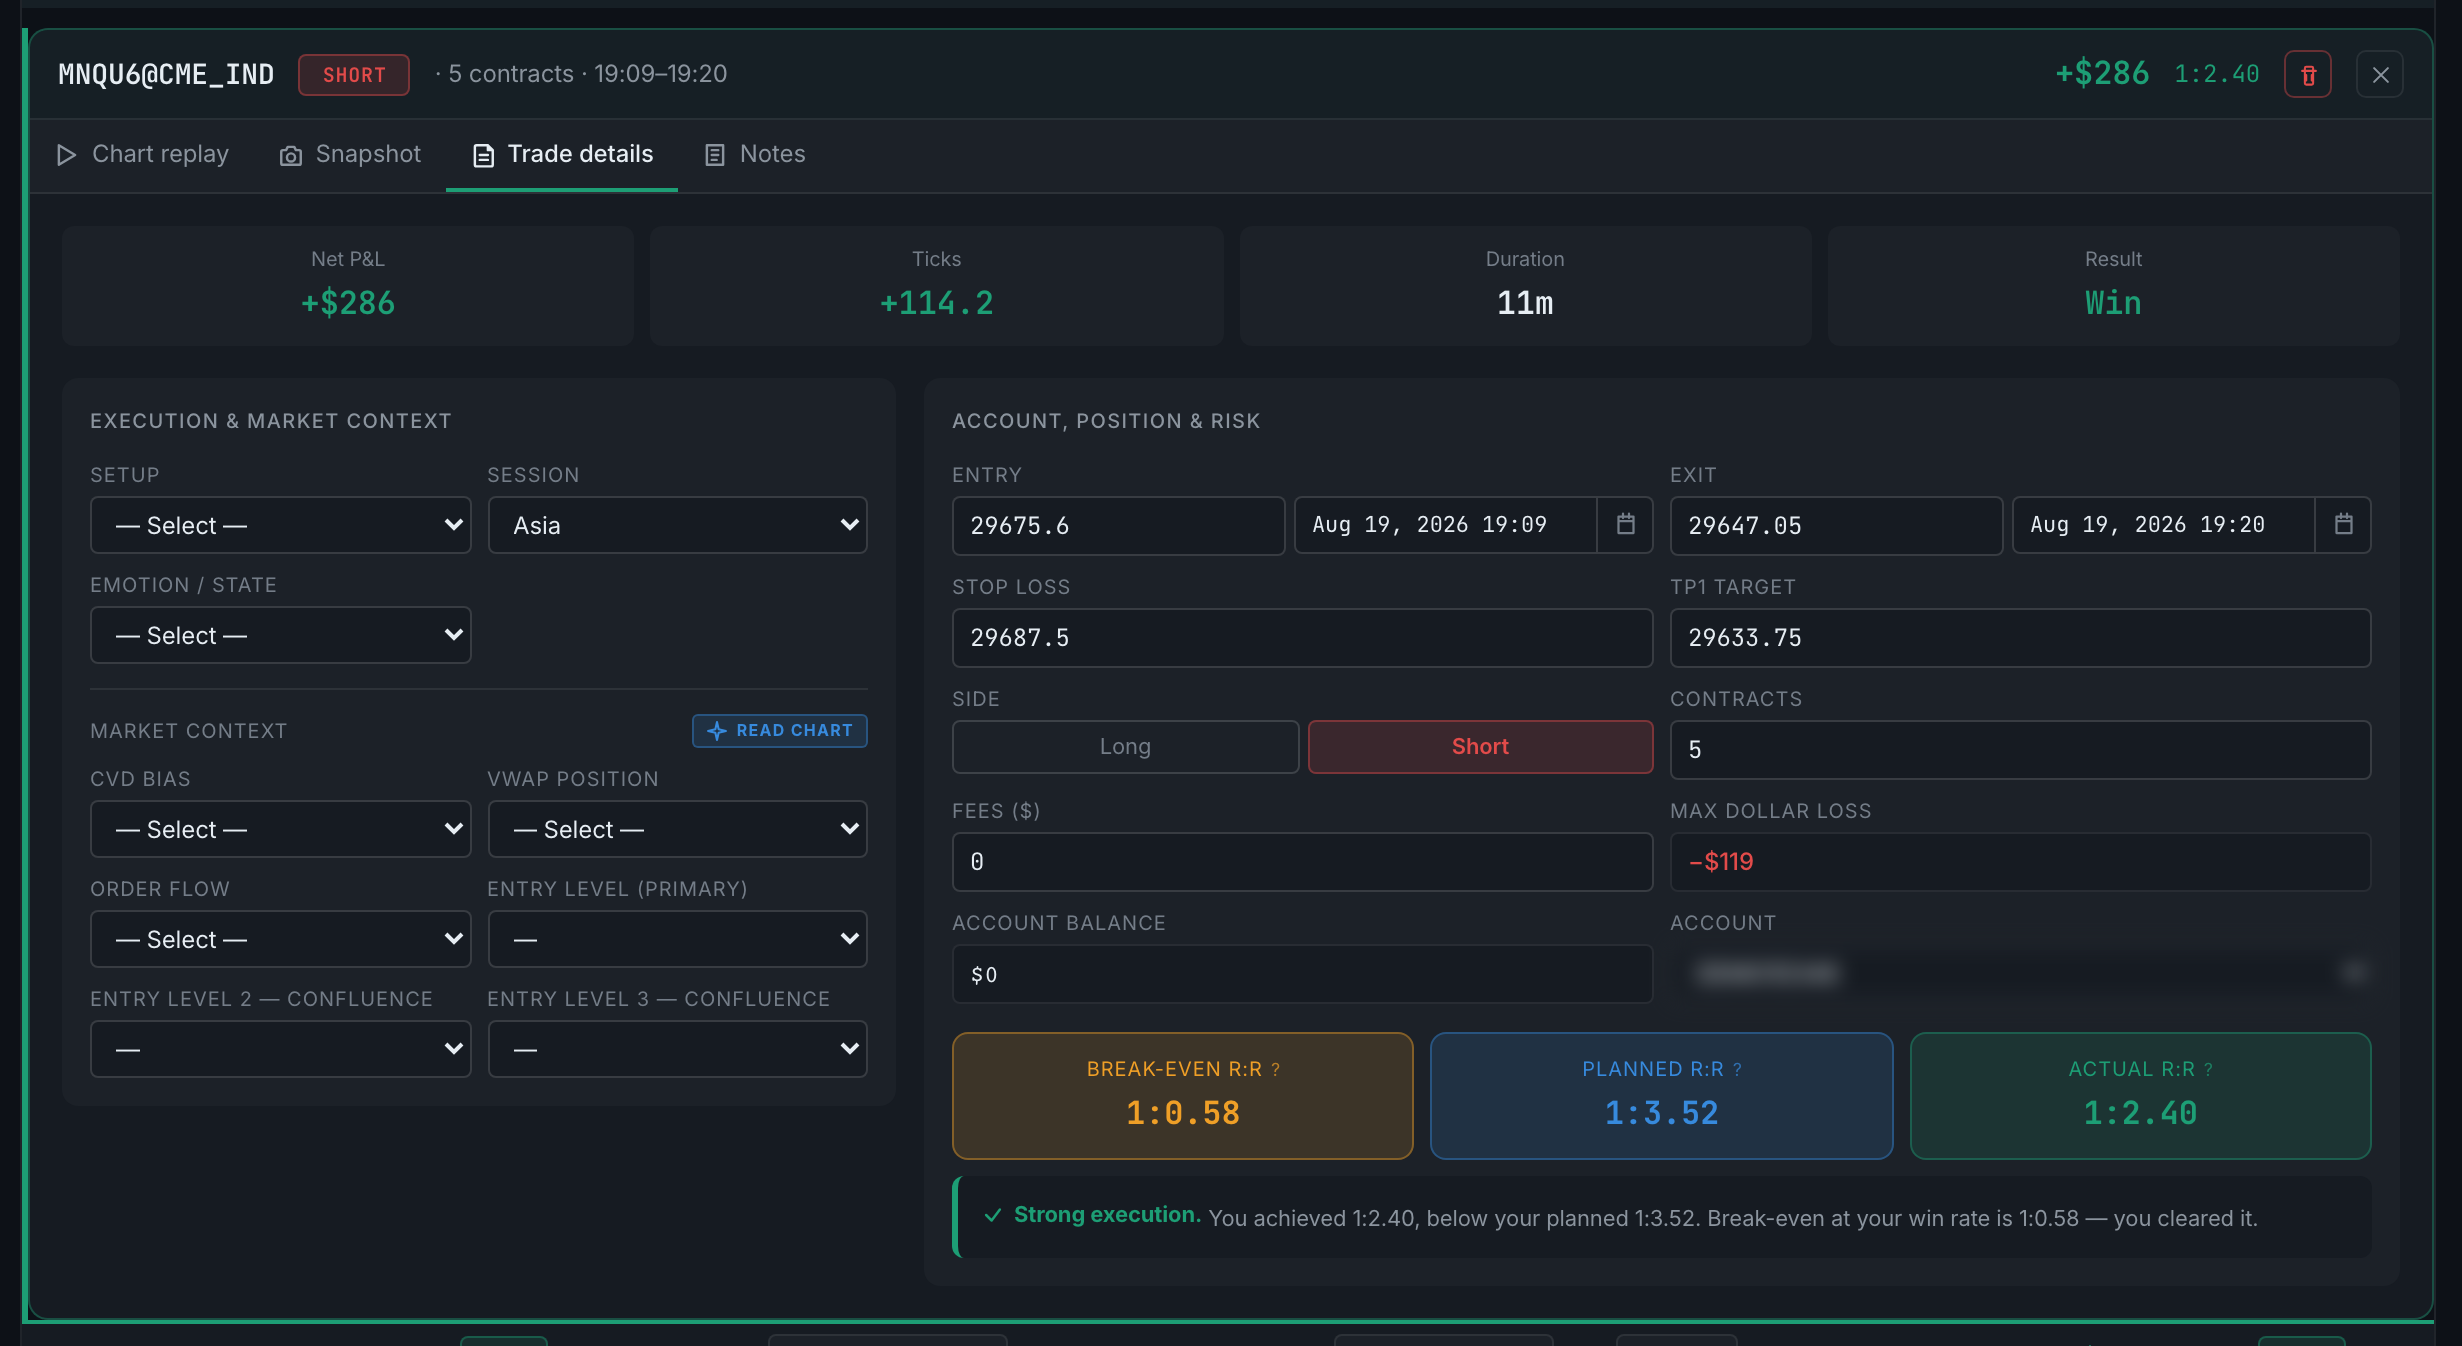
the execution and market context column - Check the position and risk figures on the right.

the account, position and risk column with the three R:R boxes - Below the boxes there is a short written assessment of how the trade went.