What is the Chart replay tab?
A replay of the real market around your trade — actual historical bars, with your entry and exit marked, that you can play back at up to 4× and draw on.
This is a proper chart, not a summary picture. It pulls the historical bars for your instrument across the window of your trade and lets you watch the move unfold the way it did at the time.
The controls sit around the edges of the chart.
- TimeframeAlong the top: 1m, 5m, 15m, 30m, 1h, 4h or 1D. Drop into the one-minute detail around your entry, or zoom out to see where that entry sat in the day.
- Entry and exit markersDrawn on the chart, with their prices in the header beside the trade's profit or loss, so you always know which candles matter.
- IndicatorsAdds studies. Each one appears as a small chip — VWAP, EMA 9, EMA 21, Volume — with an × to remove it.
- LayersControls what else is drawn over the top, including your entry and exit markers.
- Drawing toolbarDown the left, with a colour picker, so you can mark the replay up the way you would a live chart: horizontal levels, trend lines, boxes, text.
- Playback barAlong the bottom: jump to the start, step back a bar, play, step forward a bar, and a speed control offering 0.25×, 0.5×, 1×, 2× and 4×. Drag the scrubber to move anywhere in the replay, and the counter beside it shows which bar you are on out of how many. Space plays or pauses, ← and → step a bar at a time.
The most useful way to use it is stepping bar by bar from just before your entry. Watching it at one bar per keypress is much closer to how the decision actually felt than looking at the finished chart, where the outcome is already obvious.
Step by step
- Open a trade and click Chart replay, the first tab.
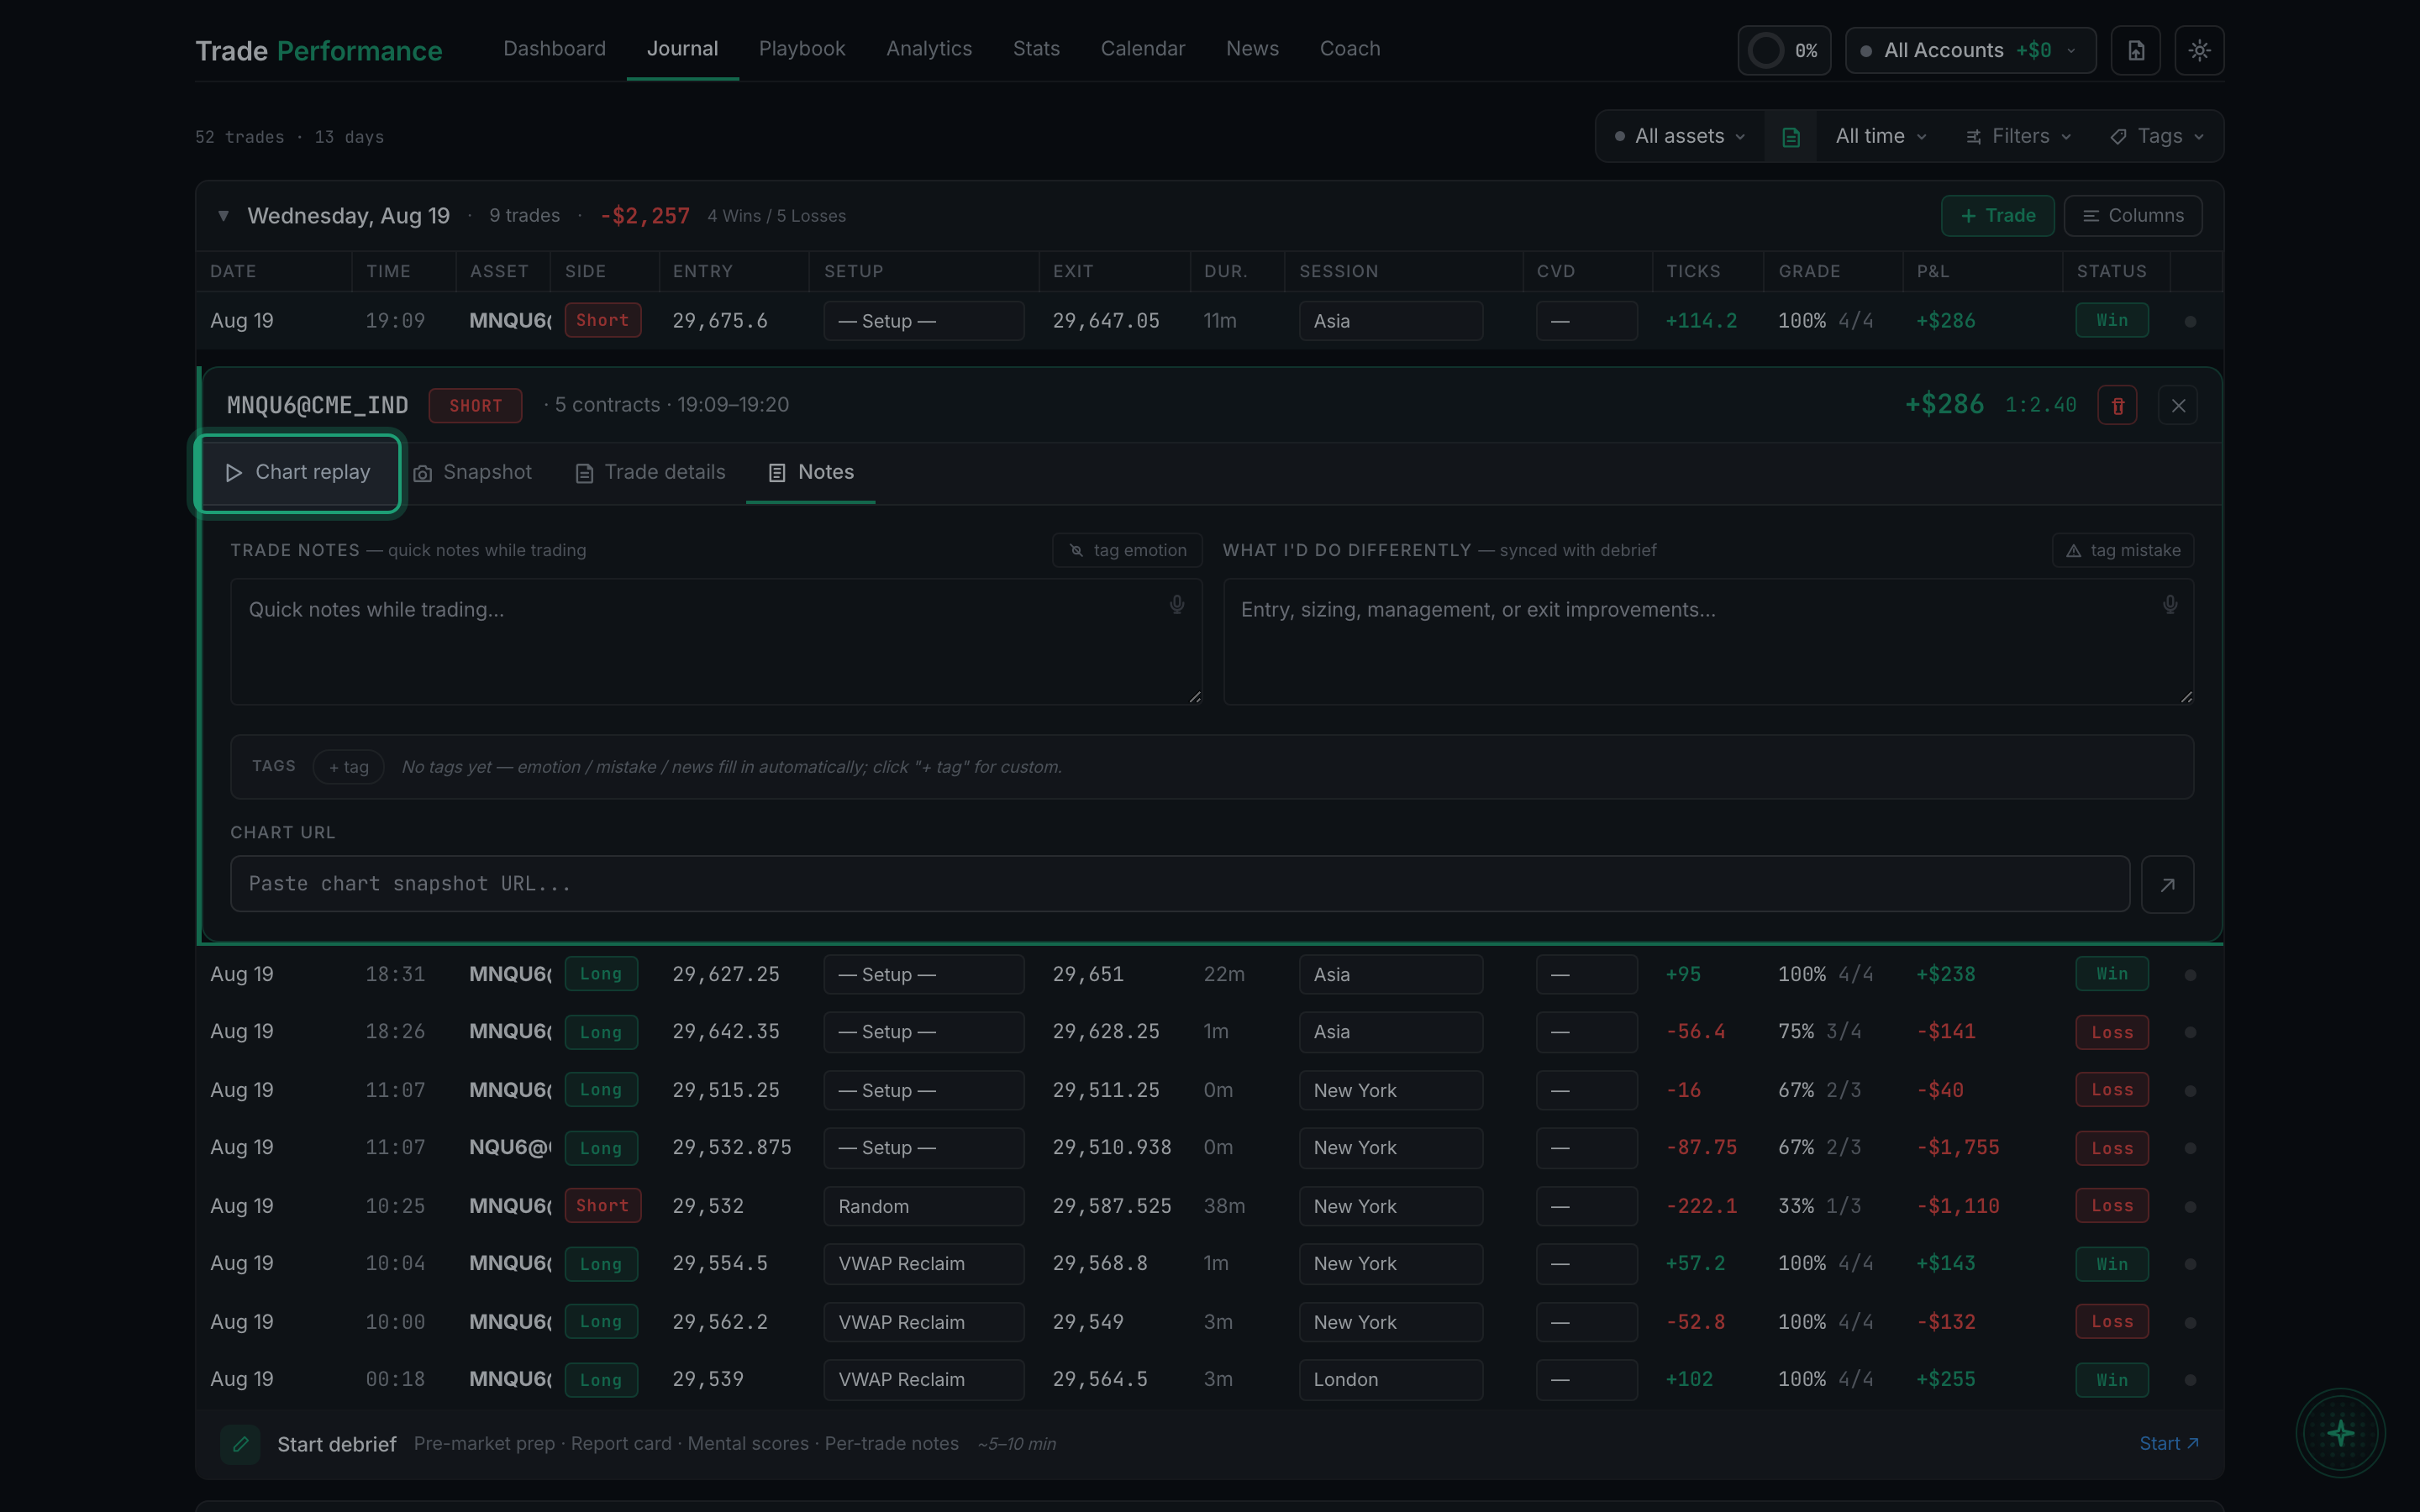
the Chart replay tab selected in the detail panel - Pick a timeframe along the top. 1m gives you the detail around entry; 1h or 1D shows where the trade sat in the wider move.journal/replay-02-chartthe replay chart with its timeframes, indicator chips and playback controls
- Add studies with Indicators. Each one becomes a chip you can remove with its ×.
- Press Play, or use the speed buttons to slow it to 0.25× through the entry and run the rest at 4×.
- Step through a bar at a time with the ← and → keys when you want to see exactly what was on screen at the moment you clicked.
- Use the drawing tools down the left to mark levels on the replay.
Replay draws on live market data, so it covers the instruments the data provider is set up for: the CME futures NQ, ES, CL, RTY, YM, GC, SI, ZB, ZN and NG, their micro versions MNQ, MES, MCL, MGC, MYM and M2K, and the major crypto pairs. A trade on anything else says so on the tab rather than drawing an empty chart.
If the chart cannot load, it tells you which kind of problem it is rather than just showing you a blank. "No bars for this time range" means the request worked and the window is genuinely empty — futures have no data over weekends or the daily settlement break. A provider error says so explicitly, and retries. That distinction is deliberate: a blank chart you mistake for real quiet is worse than an error.